
What Is a Cost Driver in LLM Spend and How to Cut It
Learn what is a cost driver in LLM spend, see real examples that inflate OpenAI and Anthropic bills, and get prioritized ways to measure and reduce it.

A cost driver is the specific, measurable factor that makes an LLM bill rise or fall. In a standard activity-based costing example, $100,000 divided across 1,000 setups produces a $100-per-setup rate, while LLM invoices usually move with token volume, request shape, cache behavior, model routing, and workload mix.
The familiar failure mode is a finance message that arrives before anyone on engineering can explain it. OpenAI or Anthropic usage appears steady, application dashboards are green, and yet the monthly charge is suddenly much higher. Teams inspect request counts, conclude that traffic didn't change, and then start debating model prices without checking the actual activity that consumed the budget.
The practical definition is narrower than “anything related to cost.” A cost driver directly changes total cost. For LLM workloads, that means the number of input and output tokens, the model selected for each request, the percentage of reusable context served from cache, and the distribution of work across features and customers. Accounting guidance describes this same principle through activities such as labor hours, machine hours, and customer contacts, with activity cost driver examples showing why allocation based on actual resource consumption is more useful than a blanket rate.
The rest of this guide treats the invoice like an engineering system. You'll see how to attribute drivers without replacing provider SDKs, what a useful dashboard exposes, and which fixes are safe enough to run first. If the problem is an unexplained spike, cost anomaly detection for AI workloads can help shorten the path from invoice variance to the responsible feature or request pattern.
Table of Contents
- When the LLM Bill Shows Up and Nobody Knows Why
- The Four Cost Drivers Behind Every LLM Invoice
- Attributing Drivers in Code Without Touching Provider SDKs
- What Good Cost Driver Visibility Actually Looks Like
- A Prioritized Playbook for Cutting Cost Drivers
- Why the Cheapest Model Is Not Always the Biggest Win
- Your First 30 Days of LLM Cost Discipline
When the LLM Bill Shows Up and Nobody Knows Why
The message usually lands in a finance channel with little context: this month's OpenAI or Anthropic invoice is roughly three times the previous one. Someone checks request volume and sees no obvious surge. The API is healthy, latency is within its normal range, and the product team hasn't announced a major launch.
The first investigation often looks reasonable but answers the wrong question. Engineers compare total calls, while the provider charges according to the contents and outcome of those calls. A stable request count can hide longer retrieved documents, a larger system prompt, more verbose JSON, a premium model selected by a new feature flag, or a cache miss pattern that forces repeated context processing.
Practical rule: Never treat request count as the bill's explanation until you've inspected input tokens, output tokens, model, cache status, and workload tags together.
A cost driver is the measurable activity that causes cost to change. Traditional activity-based costing moved companies away from broad volume averages and toward machine setups, inspection counts, purchase orders, and labor hours. The activity-based costing overview captures why that shift matters: a rate tied to the activity consuming overhead gives managers a better basis for pricing, budgeting, and profitability analysis.
For LLM systems, the equivalent activity record belongs beside every request. A support summarizer might consume a short prompt and a compact answer, while a retrieval workflow might resend a long policy library on every call. They're both “one request” in a traffic chart, but they aren't the same economic event.
The useful investigation has four questions:
- Token pattern: Did input context, generated output, or both expand?
- Model routing: Did a workload move to a more expensive model or tier?
- Cache behavior: Did reusable prefixes stop producing cache hits?
- Workload mix: Did a high-cost feature, customer cohort, or experiment gain share?
That attribution changes the response. Instead of asking who increased usage, the team can ask which activity changed, by how much, and whether the change improved the product enough to justify the money.
The Four Cost Drivers Behind Every LLM Invoice
Four drivers explain most variance in an LLM bill: model choice, prompt length, output length, and cache behavior. They interact, but they should be measured separately because each requires a different remedy. A useful AI infrastructure cost framework starts with that separation rather than collapsing everything into “tokens.”
Model choice sets the price ceiling
A request routed to a frontier model carries a different rate from the same request routed to a smaller model. GPT-4o, GPT-4o-mini, Claude Sonnet, and Claude Haiku can therefore produce very different invoice lines for similar workloads. The exact price relationship changes as providers update their catalogs, so the durable metric is cost per successful task by model, not a static ranking of model names.
An invoice example might show a support classifier using a premium model even though the task needs only a short label. The request count is ordinary, but the model column reveals that a simple workload is consuming an expensive tier.
Prompt length creates a repeated context tax
Input tokens include system instructions, retrieved documents, conversation history, and few-shot examples. A long prompt repeated across every request turns a design choice into a recurring cost driver. The LLM cost optimization guidance on prompt length gives a concrete example: a 4,000-token prompt costs about $0.12 per request on a frontier model, which reaches roughly $12,000 per month at 100,000 requests before output costs, and it reports that shortening prompts can produce 30% to 40% cost reductions.
The engineering lesson is simple. Inspect templates and retrieval payloads before assuming that only traffic is responsible.
Output length often dominates the variable bill
Output tokens are usually more expensive than input tokens. Market and FinOps guidance reports output-to-input price ratios around 4x on median, with variation from 3x to 8x by model class in the LLM cost-per-token analysis. A verbose answer, a bloated JSON object, or an unnecessarily high completion limit can therefore outweigh a stable prompt.
For example, a structured extraction endpoint may return explanatory prose alongside the fields the application stores. Reducing that response to the required schema can address the dominant driver without changing the model.
Cache behavior determines whether repeated context is cheap or full price
Prompt caching changes the economics of repeated prefixes. Cached input tokens are reported as 10x cheaper than regular input tokens for OpenAI and Anthropic, and Anthropic reports latency reductions of up to 85% for long prompts in the prompt caching analysis. The same analysis found API cost reductions from 41% to 80% across tested providers, with savings reaching 89% for GPT-5.2 and 88% for Claude Sonnet 4.5 at 50,000-token prompts.
A cache miss isn't just a performance detail. It means the same context is billed as fresh input again, so cache hit rate belongs in the cost dashboard beside token counts.
The Four LLM Cost Drivers at a Glance
| Driver | Where It Shows Up on the Invoice | Typical Cost Impact |
|---|---|---|
| Model choice | Provider, model, and token-rate lines | Can materially change cost per successful task |
| Prompt length | Input-token volume | Repeated context adds a recurring input cost |
| Output length | Output-token volume | Often dominates because output pricing is higher |
| Cache behavior | Cached versus uncached input tokens | Can reduce the effective price of repeated context |
Attributing Drivers in Code Without Touching Provider SDKs
You don't need to replace an OpenAI or Anthropic client to understand spend. An additive instrumentation layer can wrap the existing call, preserve client configuration, and attach business context before the request leaves the service. The wrapper should record the provider response rather than infer usage from request counts.
Capture the dimensions that finance can use
A decorator-style pattern works well because the same metadata contract can cover chat, embeddings, background jobs, and evaluation runs. At minimum, attach:
- Workload identity: service, project, feature, endpoint, and task.
- Ownership: team, tenant, customer cohort, and environment.
- Experiment context: release, experiment name, and variant.
- Provider facts: provider, model, request ID, status, and retry count.
- Usage facts: input tokens, output tokens, cached tokens where returned, latency, and completion reason.
- Financial facts: rate-card version, input cost, output cost, cache cost, and total estimated cost.
The rate card belongs in one central component, not scattered through application code. That keeps historical comparisons reproducible when provider prices change.

Protect streaming and retries
Streaming responses are a common source of bad attribution. A wrapper that logs only when the request starts misses final usage, while one that consumes the iterator can break the application. Wrap the stream transparently, collect the provider's terminal usage event when available, and emit one final record.
Retries need the same discipline. Each provider attempt can incur cost, so the event should include an attempt ID and a logical request ID. Don't aggregate retries into a single token total until you can distinguish a genuine second attempt from duplicated telemetry. The cost allocation methods guide is useful for deciding how those events roll up to teams, products, or tenants.
A good event lets analysts answer, “Which endpoint spent the most because output grew?” without changing the provider client or searching raw application logs.
What Good Cost Driver Visibility Actually Looks Like
A useful dashboard doesn't stop at total spend. It lets an engineer move from an invoice line to the activity behind it, then from that activity to the owning feature and release. SpendLens AI presents one example of this approach by combining project, provider, model, workload, token, and cache views without requiring a proxy in the request path. Other internal tools can work just as well if they preserve the same dimensions.
Compare drivers and surfaces separately
The first view should answer what changed. Break spending into input tokens, output tokens, model tier, cached tokens, and cache misses. The second should answer where it changed, using feature, endpoint, customer cohort, experiment flag, and environment. A third trend view should distinguish a persistent baseline shift from a one-off deployment spike.
Percentage-of-total charts can conceal a regression. A feature might remain the same share of spend while the total bill grows, or its percentage might fall while its absolute dollars rise. Show both absolute cost and share, then add request volume and cost per successful task.
| Driver | Exposing Metric | Dashboard Panel | Typical Savings Range |
|---|---|---|---|
| Prompt tokens | Input tokens per request and repeated-template share | Prompt waste and workload detail | Qualitative until measured |
| Output tokens | Output-to-input ratio and completion length | Generation efficiency | Qualitative until measured |
| Model tier | Cost per successful task by model | Routing comparison | Qualitative until measured |
| Cache behavior | Cache hit rate and uncached prefix volume | Cache efficiency | Qualitative until measured |
The AI observability platform perspective reinforces the operational point: visibility must connect technical usage to ownership and business surfaces.
Alert on variance, not just volume
A cache hit rate dropping by more than 10 percentage points week over week is a useful alert threshold when the workload depends on repeated prefixes. That threshold is an operational trigger, not proof of a universal savings outcome. Similarly, alert when a feature's output-to-input ratio climbs, or when an endpoint jumps two model tiers without a corresponding product or traffic change.
A dashboard is a prerequisite for remediation. It isn't remediation.
The strongest setup includes a daily spend trend, a driver waterfall, a workload table, and a drill-down to individual request samples with privacy-safe metadata. Without that final drill-down, teams can see that prompts grew but can't identify which template or retrieval path caused the growth.
A Prioritized Playbook for Cutting Cost Drivers
Optimization works better when the order reflects impact, confidence, and risk. Start with changes that are easy to validate and unlikely to damage quality. Leave model behavior changes and commercial commitments until the team has a trustworthy baseline.
Tier 1 uses low-risk, high-confidence fixes
Trim duplicated system instructions, remove irrelevant retrieved context, cap output length, and design repeated prefixes for caching. These changes usually preserve the model and provider, which makes A/B comparison cleaner. The FinOps guidance for forecasting AI services costs also recommends forecasting AI spend weekly or monthly and tracking cost per unit of work, such as dollars per 100,000 words or cost per GPU hour.
Instrument input and output tokens, cache status, quality checks, latency, and total cost per successful task. Run the original and revised prompt against comparable traffic, then keep the change only if quality and reliability remain acceptable. Roll back by restoring the prior template or removing the cache policy, not by reverting unrelated application code.
Tier 2 changes routing and workload shape
Route simple classification, extraction, or summarization traffic to a smaller model when an evaluation threshold confirms acceptable quality. Add semantic caching only for stable queries where stale results won't create product or compliance problems. Batch similar requests where the product can tolerate delayed completion.
Track model variant, quality score, retry rate, output length, latency, and downstream task success. Release the change to a controlled traffic slice, compare cost per successful task, and keep a feature flag ready for immediate rollback. A cheaper request that fails more often isn't an optimization.
Tier 3 carries higher implementation risk
Distillation, fine-tuning a smaller model on hot prompts, batch endpoints, request queuing, and enterprise commitment changes can have substantial upside, but they affect architecture, latency, quality, or commercial flexibility. Treat each as a project with an owner, a baseline, acceptance tests, and a rollback plan.
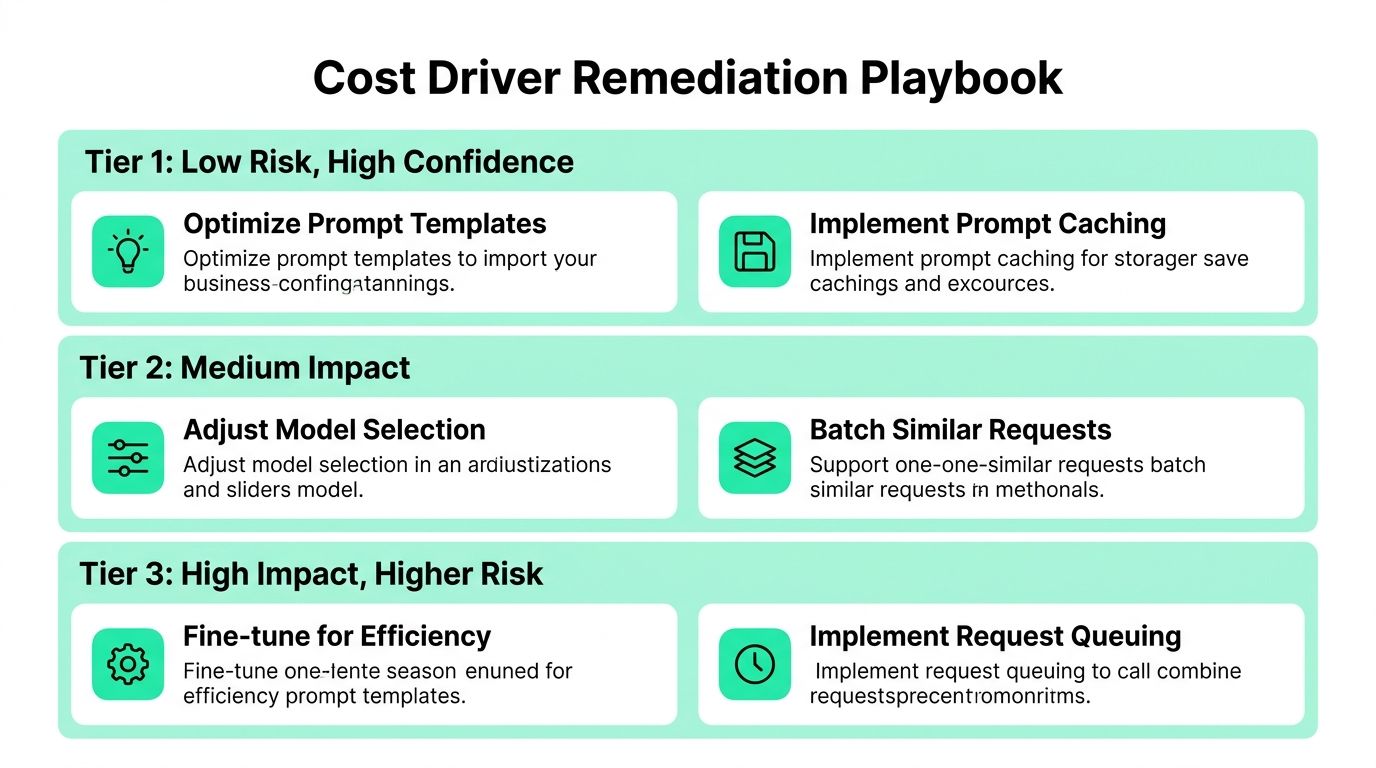
The most defensible sequence is prompt and output control first, cache-aware design next, routing after evaluation, and deeper model or contract changes last. That order produces measurable value while protecting product behavior.
Why the Cheapest Model Is Not Always the Biggest Win
Teams often start with the smallest available model because its listed per-token price looks attractive. That metric is correlated with spend, but it isn't always the driver creating variance. The real question is whether the model lowers total cost per successful task after retries, longer responses, quality failures, and downstream work.
Consider a summarization feature moved from GPT-4o to GPT-4o-mini. The per-call price may fall sharply, yet the overall bill can still rise if the smaller model produces longer outputs, misses required details, or triggers more retries and post-processing. This is a realistic failure mode, but it isn't a measured case study here, so the correct response is to instrument it rather than assume a particular result.
Use a task-level scorecard
Compare models using the same workload and evaluation set. Track:
- Completion quality: Does the output pass the product's acceptance criteria?
- Retry behavior: How often does the application ask again?
- Output shape: Are responses concise and schema-compliant?
- Cache compatibility: Does the model preserve the prefix and reuse strategy?
- Latency and failure rate: Can the product tolerate the operational profile?
- Unit economics: What does one successful task cost?
A model name can become a distraction when provider pricing changes. Analysis summarized in dynamic cost-driver guidance notes that LLM inference prices have fallen unevenly, with reported annual declines ranging from 9x to 900x, a 50x median, while 2026 trackers show wide dispersion from free tiers to high-end models. Those figures make static optimization advice age quickly.
The better decision rule is to find the driver with the greatest controllable variance. If output length fluctuates wildly, cap it before swapping models. If premium routing affects a small but expensive workload, fix routing. If repeated context dominates, cache it. Model selection matters, but it shouldn't automatically outrank the driver your telemetry identifies.
Your First 30 Days of LLM Cost Discipline
Cost control becomes durable when the team turns it into a weekly operating rhythm. Each week should produce one artifact, track one primary number, and include one short review with engineering, product, and finance. A weekly cadence catches prompt and routing regressions sooner than a quarterly invoice review.
Week 1 creates the measurement layer
Instrument every OpenAI and Anthropic call with provider, model, input tokens, output tokens, cached tokens when available, latency, retry count, feature, endpoint, tenant, and experiment tags. Export structured events to a dashboard and document the rate-card version used to estimate cost.
- Deliverable: A request-level usage schema and initial dashboard.
- Number to track: Cost per request, separated into input and output cost.
- Meeting: A short instrumentation review with platform and FinOps owners.
Don't store prompts or responses by default if metadata is enough. Hash sensitive identifiers and sample templates only when the investigation requires it.
Week 2 finds the expensive activities
Baseline daily spend by workload, provider, model, endpoint, and customer cohort. Rank drivers by absolute dollar impact, then inspect variance rather than chasing the largest request count. FinOps guidance recommends regular forecasting and cost-per-unit-of-work metrics, which makes this baseline useful for both budget planning and engineering prioritization.
- Deliverable: A ranked list of the top three cost drivers.
- Number to track: Daily spend for each top workload.
- Meeting: A spend review that assigns an owner to every driver.
A workload with modest traffic but large outputs may deserve attention before a busy, inexpensive endpoint.
Week 3 runs focused experiments
Run one experiment per selected driver. Shorten a system prompt for the prompt-heavy workload, cap generation on the output-heavy endpoint, route a controlled slice to a smaller model, or enable caching for the highest-volume repeated prefix.
- Deliverable: An experiment record with baseline, treatment, quality criteria, and rollback flag.
- Number to track: Cost per successful task.
- Meeting: A midweek check on quality, retries, latency, and spend.
Don't combine several changes in one test. If prompt trimming, model routing, and caching ship together, you won't know which lever created the savings or the regression.
Week 4 turns gains into guardrails
Lock in spend alerts, routing rules, cache monitoring, and a short retro document. The document should name the original driver, the tested change, the observed financial result, quality impact, and the rollback procedure.
- Deliverable: A maintained cost-driver playbook.
- Number to track: Weekly spend variance by workload.
- Meeting: A monthly planning review that selects the next experiment.
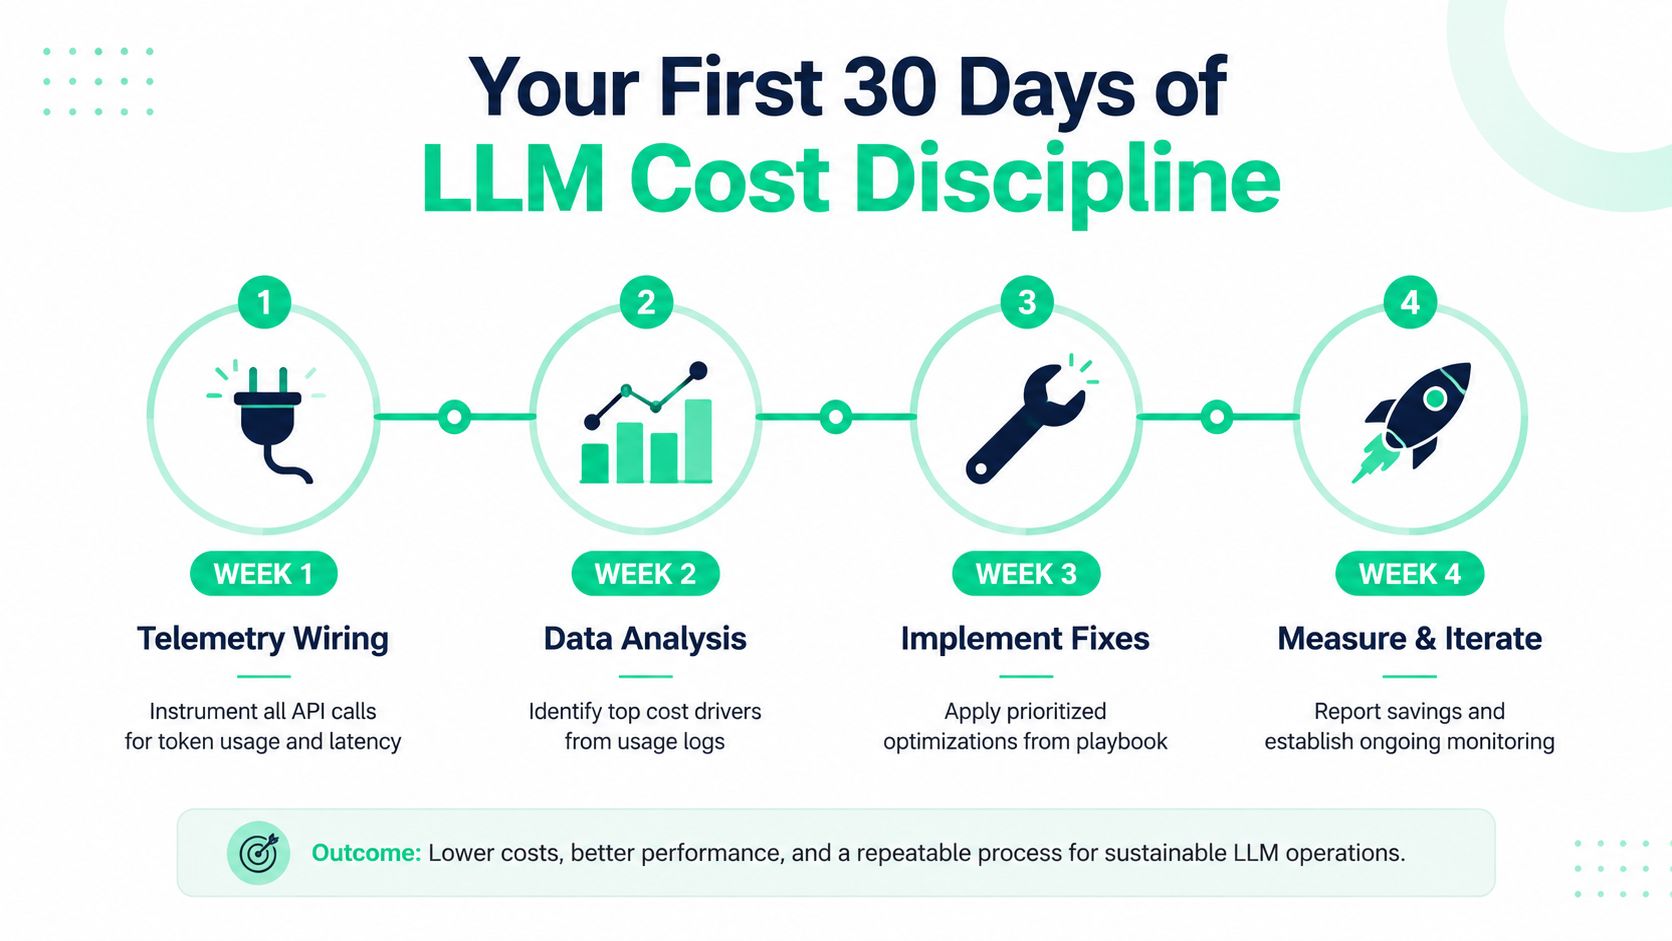
The work doesn't end after the first successful prompt change. Provider prices, product usage, model behavior, and cache patterns keep changing, so weekly reviews turn isolated savings into an operating discipline.
SpendLens AI adds lightweight instrumentation to existing OpenAI and Anthropic code, then breaks spend down by provider, model, project, workload, tokens, and cache efficiency so teams can test the drivers that move their bills. Visit SpendLens AI to review the developer workflow, dashboard capabilities, and savings recommendations before your next weekly cost review.