
Cost Anomaly Detection for LLM Spend: A Practical Guide
Learn cost anomaly detection for LLM workloads, compare detection methods, key metrics, tuning tips, and incident response with SpendLens AI.
The finance lead forwards an OpenAI invoice: $47,000, compared with $19,000 last month, and engineering has no clean explanation. The investigation eventually finds one internal workflow moved from gpt-4o-mini to gpt-4o for three days. A prompt change then doubled the input tokens, turning a model-switch problem into a much larger one.
That's the failure mode cost anomaly detection should prevent. The useful alert arrives while the workflow is changing, not after someone opens a spreadsheet and reconstructs the damage from an invoice. LLM usage is bursty, model selections can change without an obvious infrastructure deploy, cache behavior can alter effective pricing dramatically, and a runaway agent loop can consume a week of budget in an hour.
The FinOps Foundation warns that cloud cost data can lag the start of an event by as much as 36 hours, followed by more than 24 additional hours for processing and availability for analysis, making faster operational signals essential (FinOps Foundation guidance on managing cloud cost anomalies). If your only control is the monthly bill, you're not detecting an anomaly. You're performing post-incident accounting.
For teams building LLM features, the practical question is simple: would you rather receive the alert at 2:13 AM, scope the offending workflow, and contain it, or discover the same problem on the first of the month? The rest of this guide assumes the former.
Table of Contents
- When the AI Bill Arrives Higher Than Expected
- What Cost Anomaly Detection Means for LLM Workloads
- Comparing Detection Methods for Token-Based Spend
- Metrics That Surface LLM Cost Anomalies
- Wiring Detection into Your Stack with SpendLens AI
- Tuning Thresholds and Evaluating Detection Quality
- An Incident-Response Playbook for LLM Cost Spikes
- Putting Cost Anomaly Detection on a FinOps Loop
When the AI Bill Arrives Higher Than Expected
An LLM invoice can rise even when request volume looks stable. A prompt edit may double input tokens, a fallback route may select a higher-priced model, or a cache setting may change the effective cost of otherwise similar calls. Those changes can occur without a conventional infrastructure deployment, so an aggregate billing review often arrives after the operational cause has disappeared.
A useful starting point is the difference between cost visibility and cost anomaly detection. A report tells you what happened; detection provides an engineer with enough context to decide what is happening now and what action will stop it.
The FinOps anomaly-management guidance recommends tracking anomaly count, anomalous cost, detection time, and notification time. It also frames anomaly-detected cost avoidance as the difference between projected runaway cost and the amount incurred before resolution. That makes detection an operational control with an outcome to measure. The relevant question is whether the team identified the workload, model, or behavior quickly enough to limit the eventual bill.
Aggregate invoice data rarely explains an LLM incident. Per-call instrumentation does. Each request should carry a workload tag, selected model, token counts, cache state, and release or feature-flag context. Those fields can turn “AI costs increased” into “document extraction used the expensive fallback model while its prompt consumed twice the normal input context.”
That is why generic cloud monitors often stop short of useful diagnosis. The cost of AI overview from SpendLens AI describes the attribution problem, including the need to connect spend with projects, models, and workloads instead of leaving finance with an opaque provider total.
Practical rule: Treat the invoice as a reconciliation artifact. Treat per-workload, per-model, and cache-aware telemetry as the detection surface.
What Cost Anomaly Detection Means for LLM Workloads
An LLM cost investigation starts with the request, not the invoice. Compare calls from the same workflow, model, cache state, and release context, then trace which dimension shifted. A total spend increase of 18% may be reasonable when traffic increased by 25%. With flat request volume, the same increase can indicate a pricing, prompt, retry, or routing problem. Cost per request, cost per successful task, tokens per request, and cache-adjusted input cost supply the denominator an invoice lacks.
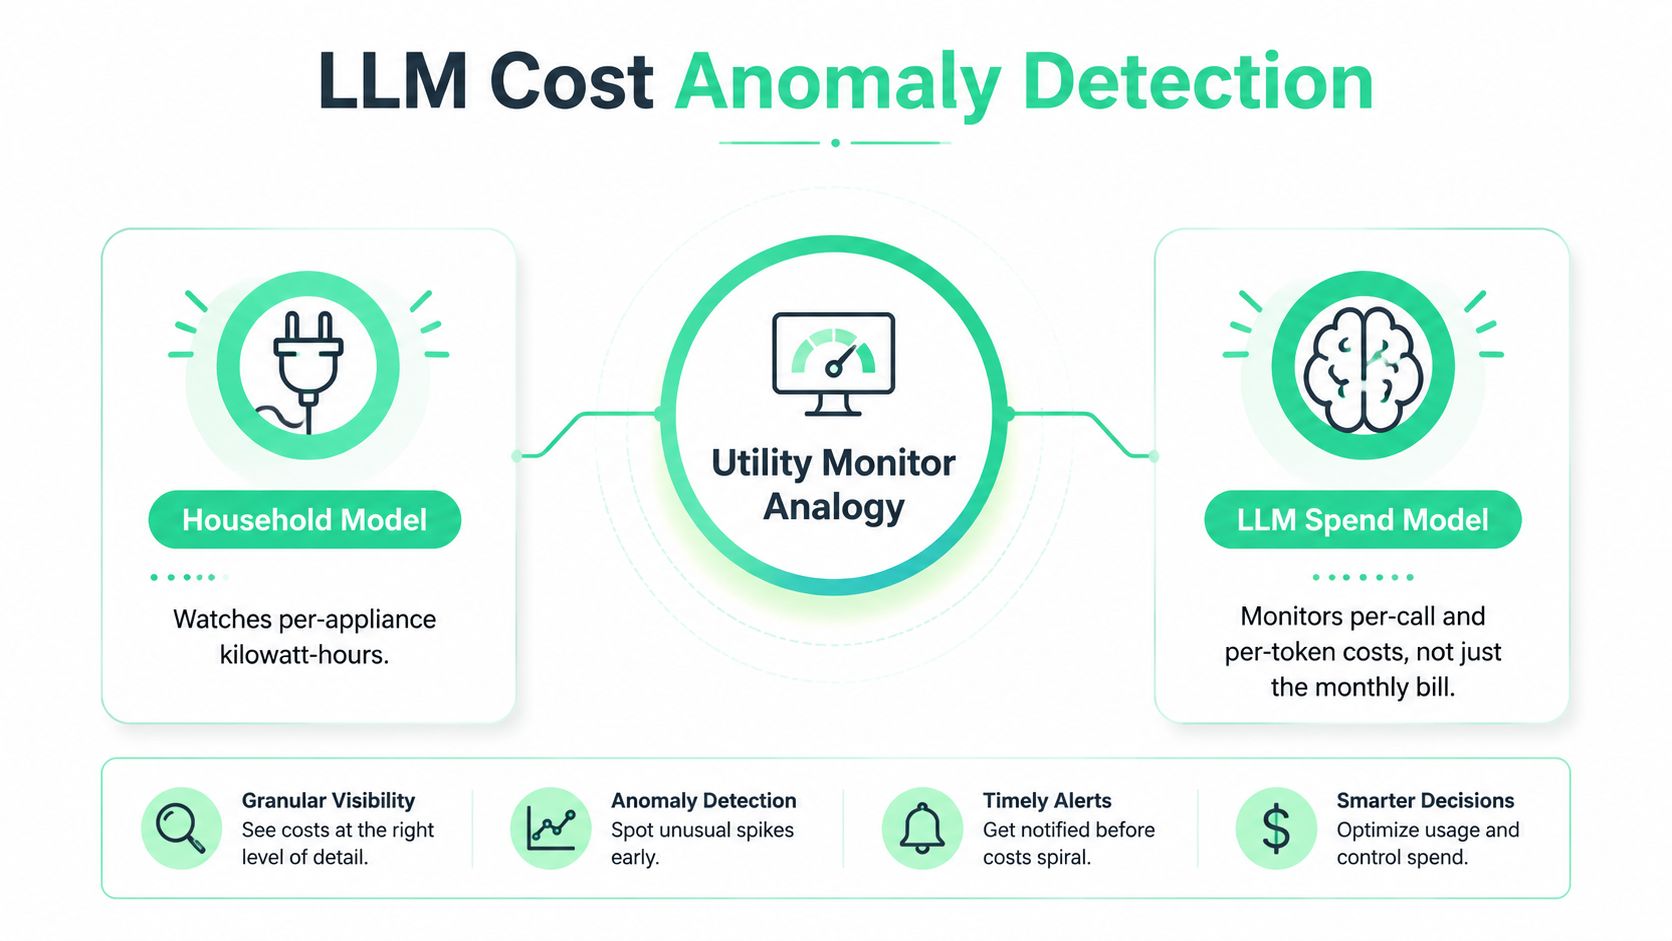
A workload detector connects each call to dimensions such as:
- Workflow: document extraction, support response, evaluation, or agent planning.
- Model: provider, model family, version, and fallback route.
- Token economics: prompt tokens, completion tokens, cached input tokens, and output length.
- Execution context: team, feature, environment, release, and experiment.
- Operational behavior: retries, streaming completion, latency, and cache-hit state.
These fields turn “AI costs increased” into a testable finding, such as document extraction using an expensive fallback model while its prompt consumed twice the normal input context. They also separate genuine demand growth from changes in token consumption or execution behavior.
LLM cost follows model pricing and token use, with caching, retries, fallback behavior, and request patterns modifying the result. A detector that receives only dollars can flag movement. Per-call telemetry can identify the mechanism and assign the investigation to the team that owns it.
The FinOps Foundation describes anomaly management as a statistical process using historical baselines and known future events, rather than a single fixed threshold (FinOps guidance on anomaly detection). Google Cloud's approach monitors actual spend hourly and forecasts expected daily spend from historical and seasonal trends, while Oracle describes forecasts that account for daily, weekly, yearly, and holiday seasonality (Google Cloud's cost anomaly detection overview). For LLM workloads, those methods become more useful when each baseline is scoped to a workload and model.
This guide treats detection as an instrumentation problem. SpendLens AI tags provide the organizing layer, while provider SDK wrappers, OpenTelemetry attributes, warehouse events, and cloud-native monitors can implement the same per-call view. Aggregate invoice monitoring still has a reconciliation role, but it should not be the primary detection surface for token-based spend.
Comparing Detection Methods for Token-Based Spend
No detector catches every LLM failure mode. A practical design assigns each method to the signals it can interpret, then anchors those signals to a workload, model, and cache state through SpendLens AI tagging. That avoids treating an aggregate invoice increase as the anomaly itself.
Statistical baselines are a low-cost starting point. A rolling mean, median, or z-score can catch a sudden step-change, such as a workload switching from gpt-4o-mini to gpt-4o. The method is fast and easy to explain, but gradual prompt drift can pass unnoticed. A baseline that ignores weekly seasonality may also flag normal Monday traffic.
Time-series forecasting handles recurring demand more effectively. Holt-Winters, Prophet-style models, and STL decomposition can separate weekday behavior from weekend traffic or a seasonal campaign. Bursty agent traffic remains difficult, and a newly launched workflow needs a fresh baseline because historical data may describe a different operating shape.
Machine-learning detectors combine token volume, latency, cache-hit rate, model identity, and per-call cost. Isolation forests, autoencoders, and other multivariate models can surface compound events, such as rising spend while token volume remains flat. That pattern often points to cache failure. Operations are harder: feature quality must remain consistent, and sparse incident labels limit evaluation.
Rule-based alerts produce the clearest response path. “Alert when workload spend exceeds its baseline,” “notify when cache-hit rate drops,” and “flag an unexpected model switch” can each map to a runbook. Set suppression windows, minimum spend floors, and maintenance periods, or normal variation will create alert floods.
| Method | Best at catching | Breaks on | Data needs | Operational cost |
|---|---|---|---|---|
| Statistical baseline | Sudden step-changes | Gradual drift and seasonality | Historical spend or usage | Low |
| Time-series forecast | Recurring traffic patterns | Bursty agents and new workflows | Clean time series with calendar context | Medium |
| Machine learning | Compound, multivariate anomalies | Poor features and limited incident labels | Token, latency, cache, model, and outcome features | High |
| Rule-based alerting | Known failure modes | Normal variation and alert floods | Explicit workload metrics | Low to medium |
Managed cloud monitoring, including AWS cost anomaly detection guidance, can provide a useful account-level safety net. It should not replace request-level instrumentation for token spend. For implementation details, compare this layered approach with the AWS cost anomaly detection guide for LLM workloads. Use forecasts for expected behavior, rules for known risks, and multivariate detection for interactions that global thresholds miss.
Metrics That Surface LLM Cost Anomalies
A provider invoice can show that spend rose. Request-level instrumentation shows which workload caused it. For LLMs, that distinction matters because one prompt change, cache failure, or fallback model can raise unit cost while account totals still look normal.
Per-call cost and token counts
Track per-call cost in cents whenever provider pricing and usage data support the calculation. Group the result by workload, model, release, and environment. A workflow can keep the same request volume while input tokens rise sharply after a prompt refactor, and unrelated traffic can conceal that change in aggregate totals.
Keep prompt and completion tokens separate. Rising completion tokens point toward output limits, agent loops, or response-format changes. Rising input tokens usually indicate larger templates, retrieved context, repeated instructions, or cache misses. Add successful-task count where the application exposes it, then monitor cost per successful task rather than spend alone.
Cache efficiency and model identity
Prompt caching needs its own time series. Cached input tokens can be 10x cheaper than regular input tokens for OpenAI and Anthropic APIs, while Anthropic prompt caching can reduce latency by up to 85%, according to ngrok's prompt-caching guide. An independent evaluation across OpenAI, Anthropic, and Google measured API cost reductions from 41% to 80% and time-to-first-token improvements from 13% to 31% across providers in 500 agent sessions using 10,000-token system prompts (the independent prompt-caching evaluation).
A cache-hit collapse can create an anomaly while calls and token counts remain steady. Record cache reads, writes, misses, and the stable-prefix identifier when the provider exposes it. Compare those signals per workload and model, not against one global cache target.
Model switches and workload attribution
Silent fallback deserves a separate alert. Store both the requested model and the model used, then compare switches by workload, release, and environment. Roll spend up through stable SDK tags such as workflow, feature, team, environment, and experiment. Inconsistent names split one economic unit across partial histories and weaken the baseline.
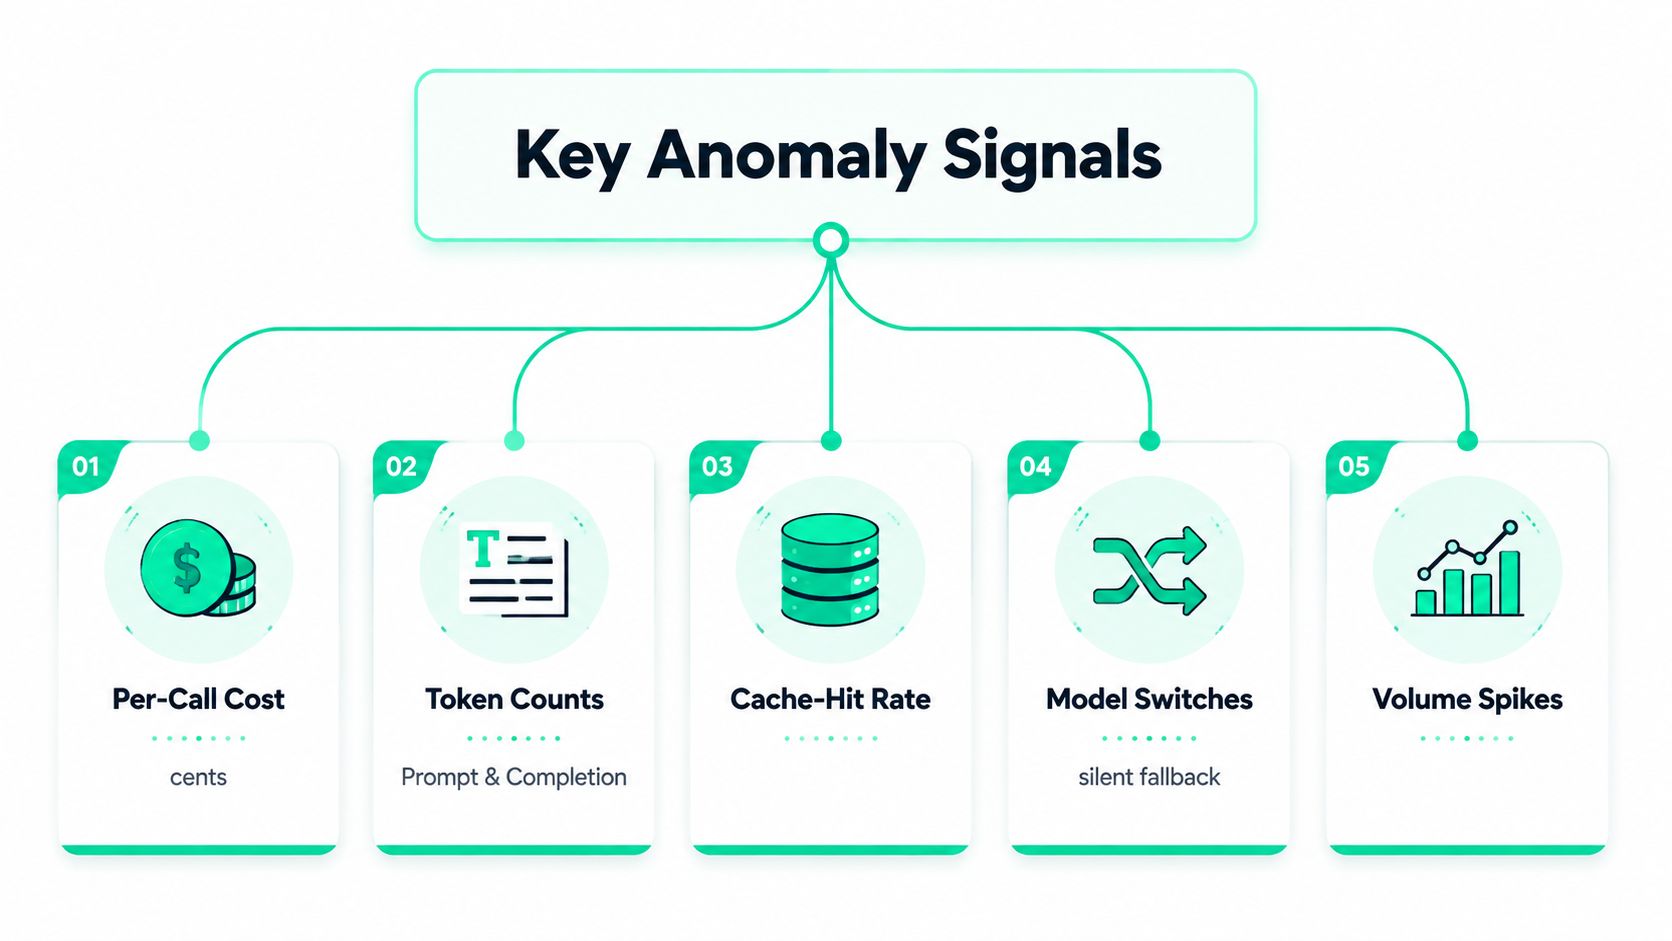
SpendLens AI combines workload, provider, model, token, cache, and per-call dimensions through its AI observability platform. This lets detection compare one feature's unit economics instead of waiting for an invoice-level deviation.
A useful anomaly question: What changed in cost per successful task, even if request volume stayed flat?
Wiring Detection into Your Stack with SpendLens AI
A small prompt edit can expose a cost problem before the invoice does. An engineer adds retrieved context to a customer-support workflow, input tokens rise for that workflow, and unrelated traffic stays normal. A provider dashboard eventually shows the higher total. Tagged events can identify the affected workload much earlier.
Decorate every model call with stable dimensions. The exact SDK method depends on the implementation, but each event should include the workload, model, feature flag, environment, and release. A lightweight wrapper might look like this:
from spendlensai import observe, track

@observe(
    workload="support-answer",
    feature="agent-reply",
    environment="production"
)
def generate_answer(client, messages):
    return client.chat.completions.create(
        model="gpt-4o-mini",
        messages=messages
    )
Decorator syntax matters less than naming discipline. If one service uses support-answer and another uses support_response, the dashboard treats one economic unit as separate histories. Standardize tags in the wrapper or SDK, then reject or quarantine events missing required dimensions.
Build the dashboard around workload and model behavior, with spend, input tokens, output tokens, cache-hit rate, selected model, and release visible together. Filter by environment and workflow before comparing the current rolling window with its historical baseline. A useful event might identify support-answer, production, and a release with increased input tokens. An untagged provider total leaves the engineer searching application logs.
Route alerts to the team that owns the workload, rather than a shared finance inbox. Use the workload baseline and an absolute cost floor, then include workflow, model, current and expected cost, token movement, cache movement, and release in the notification.
SpendLens AI supports SDK tagging, workload-level spend views, cache-efficiency signals, prompt-waste indicators, and model comparisons while provider calls follow their normal path. Teams using endpoint telemetry can also consult the endpoint monitoring guide for a related way to connect application operations with cost events.
Test the response loop before production. Change a test prompt, verify the token event, confirm that the workload remains correctly grouped, trigger the alert, and check that the notification contains enough context to act without opening several systems.
Tuning Thresholds and Evaluating Detection Quality
Threshold tuning is an ongoing control task. Build two baselines for each workload, model, and cache pattern: one for recent behavior and another for a wider seasonal window. A 7-day baseline responds quickly to operational changes, while a 28-day baseline captures weekly behavior and provides more context. Keep these baselines tied to SpendLens AI tags instead of an aggregate provider invoice, or unrelated workloads will distort the comparison.
Start with an alert near 1.5x to 2x the workload baseline, plus an absolute cost floor. The multiplier catches meaningful movement, while the floor prevents low-volume jobs from paging engineers over negligible spend. Back-test both settings against your own history. A low-volume evaluation job, a batch workflow, and a customer-facing agent need different sensitivity because their normal variance and consequences differ.
Route alerts by consequence
Use severity tiers based on workload impact. A lower-severity event can create a ticket or enter a daily digest. A higher-severity event can page the owning engineer when the workload serves customers, the selected model changes unexpectedly, or the cache-hit rate drops sharply. Suppress repeated notifications during an active incident, and define maintenance windows for planned migrations and load tests.
Track detection time, notification time, anomaly count, anomalous cost, and cost avoidance, metrics also used in FinOps anomaly-management practice. Add false-positive rate, mean time to acknowledge, mean time to contain, and the share of historical cost variance captured by alerts.
Evaluation rule: Reliable detectors page people for genuine anomalies without generating noise during normal traffic. Useful detectors provide enough workload, model, token, and cache signal for someone to act.
Back-test each change against known incidents and quiet periods. Check whether the alert would have fired before the invoice, identified the owning team, and tolerated ordinary seasonality. Recalibrate after prompt caching changes, model mix shifts, new workflow launches, or traffic movement between environments.
Review the configuration regularly. Examine tag coverage, missing usage fields, baseline contamination from previous incidents, suppression rules, and the relationship between alert impact and actual remediation. Keep confirmed incidents in a small catalogue. Real examples show which per-workload signals preceded waste, making them more useful than an abstract accuracy target.
An Incident-Response Playbook for LLM Cost Spikes
A support-answer workload began returning unusually expensive requests after a release. SpendLens AI flagged the spike by workload and model, rather than waiting for the aggregate invoice to move.
First five minutes
Acknowledge and scope. Confirm the alert, identify the owning team, and filter the dashboard by workload, model, environment, and recent window:
cost(workload="support-answer", model="gpt-4o", environment="production", window="last_60m")
Compare actual and expected cost. Check whether the change is isolated or spreading to related workloads. Capture the alert payload, including the affected tags, primitive signal, baseline, and current value, before anyone changes configuration.
First thirty minutes
Inspect the driver, not just the total. Rank calls by input token count and compare cache-hit rate with the per-workload baseline. Review model switches, retries, completion lengths, and the latest release or feature-flag change:
top_calls(workload="support-answer", order_by="input_tokens", window="last_60m")
In one investigation, volume stayed flat while input tokens doubled. The team traced the increase to retrieval output being appended twice, disabled the release, and watched per-call cost return to its expected range. The alert became a permanent input-token rule for that workload, with the model and environment retained as dimensions.
If tokens remain stable while cost rises, check cache misses or a model fallback. Expanded completion tokens can indicate an agent loop or response-format regression.
Contain the exposure. Roll back the prompt, disable the feature flag, cap agent iterations, restore the intended model, or route traffic to a lower-cost model where quality permits. Record the action and timestamp so the cost-avoidance estimate has a defensible resolution point.
Within the first day
Verify and document. Confirm that per-call cost returned to its expected range. Create a postmortem covering the trigger, affected workload, root cause, containment, and permanent fix. Add a detector for the specific failure mode, such as a model-switch rule or cache-hit floor.
The same operating discipline used for cloud cost alerts applies here: detect, notify, investigate, and respond. Token workloads require the investigation to reach request, model, cache, and workload dimensions instead of stopping at aggregate spend.
A useful dashboard answers three questions without another data pull: which workload changed, what primitive moved, and who can contain it. If it cannot, improve instrumentation before adopting a more advanced detection model.
Putting Cost Anomaly Detection on a FinOps Loop
Cost anomaly detection becomes durable when detection, response, and tuning operate as one loop. Each confirmed incident should improve a workload tag, baseline, suppression rule, dashboard panel, or runbook step. Evaluate threshold changes against detection time, false-positive rate, and captured cost variance.
A practical rollout for a team spending $2K to $50K per month is:
- Tag every call from day one. Record workload, model, provider, team, environment, release, and feature flag. A small consistent vocabulary is more useful than a broad taxonomy with gaps.
- Build a provisional baseline after 7 days of traffic. Keep collecting data until it covers normal operating patterns.
- Enable alerts after the baseline stabilizes. Set workload-level rules with a minimum cost or volume floor, then route each alert to the responsible engineering channel.
- Review false positives weekly. Classify them as expected variation, data-quality failure, planned change, or genuine anomaly.
- Tune from confirmed incidents. Add cache, token, model-switch, or prompt-waste signals when spend alone cannot explain the variance.
- Review unit economics with finance and product. Cost per successful task connects LLM usage to the feature's business purpose more clearly than provider spend alone.
Prompt caching can produce material savings when requests share a stable prefix. One real-world report measured overall savings of 59%, increasing to 66% after further optimization and reaching 70% over the last 10 days, based on actual spend rather than list-price estimates (ProjectDiscovery's prompt-caching report). A separate guide reports that reducing input-token cost by 80% to 90% can be realistic for workloads with large stable prefixes and high hit rates (Redis prompt-caching guide). Detection should therefore expose cache-efficiency changes by workload and model, not only invoice growth.
Set a review cadence before enabling production alerts: weekly detector review, monthly unit-economics review, and an incident review after every confirmed spike. Instrument the highest-cost workflow first, then require its dashboard to show workload, model, cache, token, and release dimensions. A useful operating target is to explain every confirmed alert through one of those dimensions and record the containment action and avoided-cost estimate.
SpendLens AI adds lightweight tagging and dashboards for LLM spend across OpenAI and Anthropic workloads, including per-workload cost, token usage, cache efficiency, model switches, and prompt-waste signals. Visit SpendLens AI to instrument a high-cost workflow, establish a baseline, and catch spend anomalies before they reach the invoice.