AWS Cost Anomaly Detection for LLM Workloads
Set up AWS Cost Anomaly Detection to catch unexpected AI spend spikes. Learn detector tuning, alerting, root-cause analysis, and remediation for LLM workloads.
Monday morning starts with a Slack message nobody wants to read. The AI feature that looked cheap in staging now has a bill that doesn't look like a typo, and the product team swears they only changed a prompt template and a model choice. That's the trap with LLM workloads, the cost spike often comes from token volume, cache behavior, or a quiet routing change, not from any obvious infrastructure event.
AWS Cost Anomaly Detection is useful because it watches spend deviation instead of waiting for a budget to blow up. It spots one-time spikes and continuous increases using historical patterns, and AWS's own details page breaks each anomaly into expected spend, actual spend, cost impact, and impact %. That gets you to “something changed,” but not to “the summarization endpoint started sending full documents into the prompt after last night's deploy.”
The operational gap is the hard part. AWS can tell you the anomaly is real, but the engineering team still has to connect that alert to a workload, a prompt revision, a model switch, or a cache miss before the invoice gets worse. The fastest teams treat detection as the first signal, not the answer.
Table of Contents
- Why AI Bills Spike Without Warning
- Creating Cost Monitors and Alert Subscriptions
- Segmenting LLM Workloads with Tags and Categories
- Wiring Alerts into Incident Workflows
- Investigating Root Causes with SpendLens AI
- Remediation Patterns That Actually Save Money
- Building a Proactive AI FinOps Practice
Why AI Bills Spike Without Warning
A support team ships a small prompt tweak on Friday, and by Monday the AI spend has jumped hard enough to trigger an all-hands panic. Nothing about the underlying cloud footprint changed in the usual way, but the model started seeing longer context, the cache hit rate dropped, and one feature became a token furnace.
The kinds of changes that hurt LLM spend
Traditional cloud bills usually move when you add instances, raise throughput, or leave a resource running. LLM bills behave differently, because prompt length, output length, model selection, and cache behavior can all move the bill without any obvious infrastructure footprint. A single product change can change how often the model is called, how many tokens each call burns, and which provider or model gets hit.
That's why standard budget alerts often arrive late. They tell finance that spend is up after the fact, but they don't tell the platform engineer which feature drove it or whether the rise is a legit usage spike or a prompt regression. AWS Cost Anomaly Detection is built to catch those deviations earlier by comparing actual spend against historical expectations rather than waiting for a static budget rule to trip. AWS also says the service uses a multi-layered machine learning model that learns spend patterns and adapts thresholds over time instead of relying on manual percentage rules AWS Cost Anomaly Detection documentation.
Practical rule: if a deploy changes prompts, model routing, or caching, treat the AI bill as part of the release blast radius.
What AWS tells you, and what it doesn't
AWS does give useful operational context. The anomaly details show expected spend, actual spend, cost impact, and impact %, and AWS defines cost impact as actual spend minus expected spend AWS Cost Anomaly Detection details. That means the detector is good at saying, “you spent more than the historical pattern predicted.” It's not trying to explain whether the cause was a prompt template, a new model, or a cache invalidation event.
That distinction matters in AI ops. A billing alert can protect you from weekend surprise, but it won't tell you which customer-facing feature needs to be rolled back. The fastest win is not just catching anomalies within hours instead of a billing cycle, it's getting from alert to attributable workload before engineers start guessing.
For teams comparing usage patterns at the API level, the cost-of-call baseline is worth understanding too, especially when AI traffic is mixed across tools and endpoints. A useful companion read is SpendLens AI's breakdown of API cost behavior, because the billing issue usually starts at the request level long before it shows up in AWS reporting.
Creating Cost Monitors and Alert Subscriptions
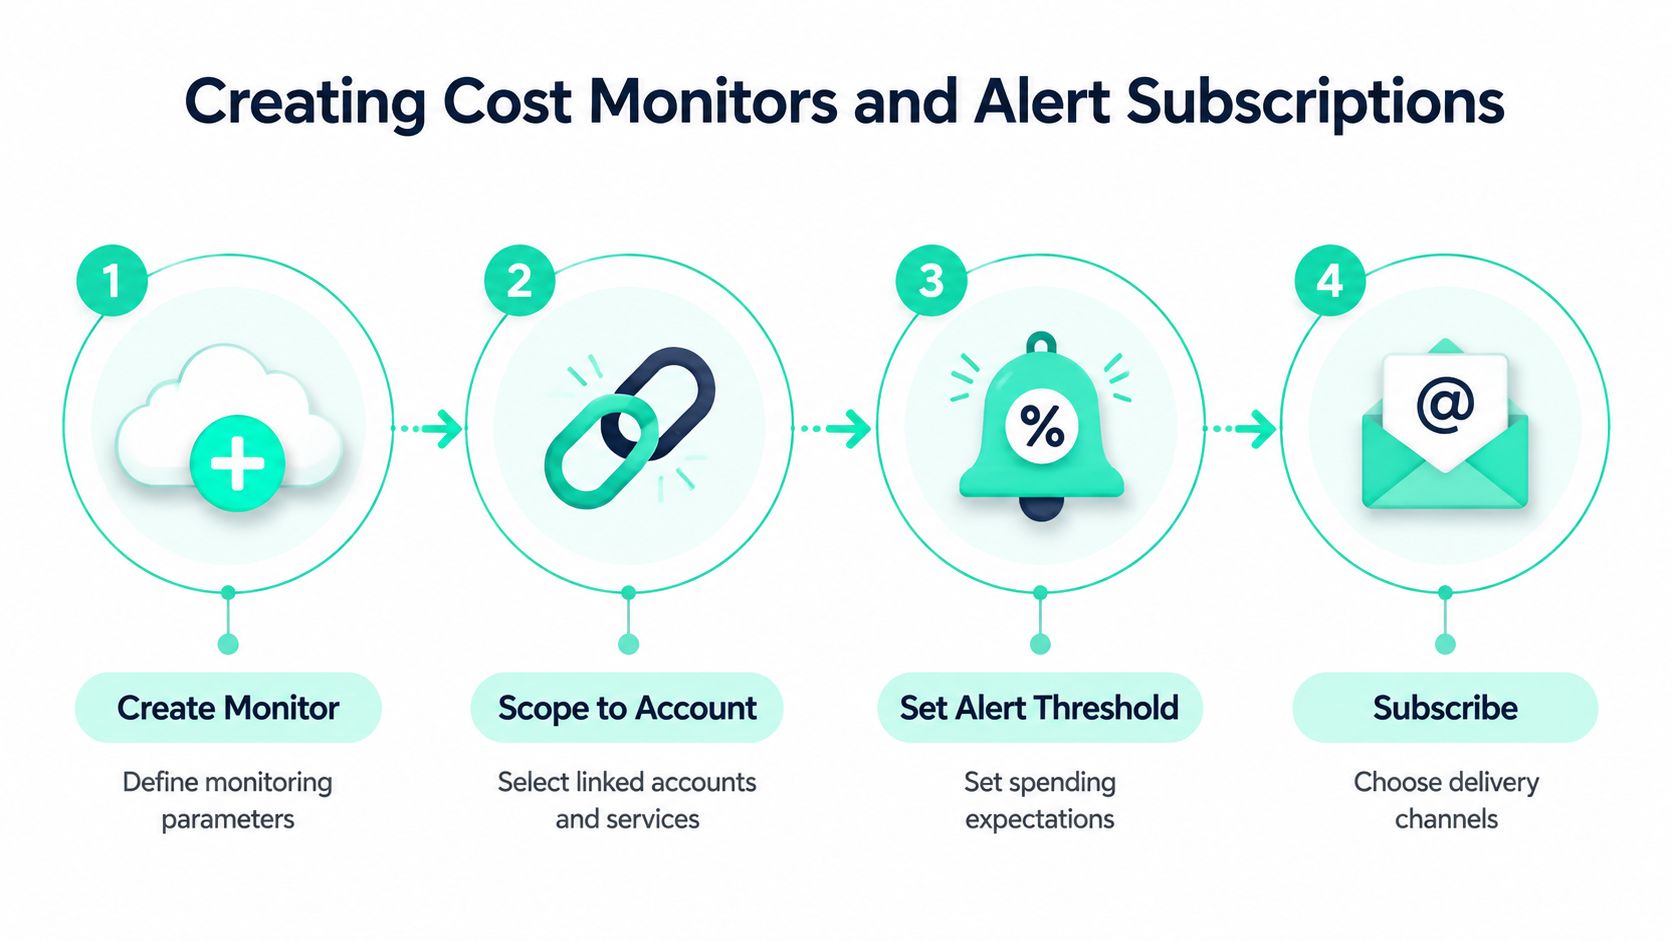
A surprise jump in an AI bill usually shows up in AWS before anyone can explain it. AWS Cost Anomaly Detection gives you the alert, but you still need to set up a cost monitor and an alert subscription so the service can learn the spend pattern for the scope you care about. The console and API both support that setup, and AWS's FAQ shows that you can filter and inspect anomalies by Severity, Assessment, Service, Account, Usage type, Region, and Monitor type AWS Cost Anomaly Detection FAQs.
Pick the monitor scope that matches ownership
For LLM workloads, monitor scope is the first choice that changes how useful the alert will be. If you only watch account-wide totals, a spike from one chat feature gets buried inside the rest of the platform. AWS documents monitor scopes for linked accounts, cost allocation tags, and cost categories, and its 2025 update expanded managed monitoring so one managed monitor can cover all linked accounts, all tag values, or all category values in a dimension AWS managed monitoring update.
That works well if your organization already uses tags or cost categories to separate product teams. A SaaS company can track each product team separately, or isolate a single AI feature by its own tag, so a spike in document summarization does not get mixed up with support chat. If your environment is still coarse-grained, start with the dimension that already reflects ownership, then tighten the scope after you see where the noisy spend is coming from.
Practical rule: the best monitor is the one that matches who can actually fix the spend, not the one that looks neat in a dashboard.
Tune thresholds so alerts mean something
AWS supports explicit dollar and percentage thresholds. Their setup examples include a $50 absolute threshold, an 80% deviation threshold, and a combined rule that alerts only when an anomaly is both $50 and 80% above expected spend AWS anomaly detection setup guidance. That matters because AI teams often run features with very different baseline spend. A low-volume internal assistant and a high-volume support bot should not use the same tolerance for noise.
A combined threshold is often the cleanest starting point. It filters tiny blips while still catching large proportional changes, which is what you want when one prompt revision can raise token use without changing request volume much. Once the alert subscription is active, the goal is to get a signal that behaves like an incident, not another generic billing notice.
For endpoint-heavy services, compare alerts to request shape and release timing. The setup is easier to interpret if your operational view already separates AI endpoints by function, which is why the endpoint-level attribution guide matters when you wire the rest of the workflow.
Segmenting LLM Workloads with Tags and Categories
An AWS cost anomaly without attribution is just expensive noise. The useful question is not only whether spend went up, but which workload, which team, and which release caused it.
Build tags for real ownership, not decoration
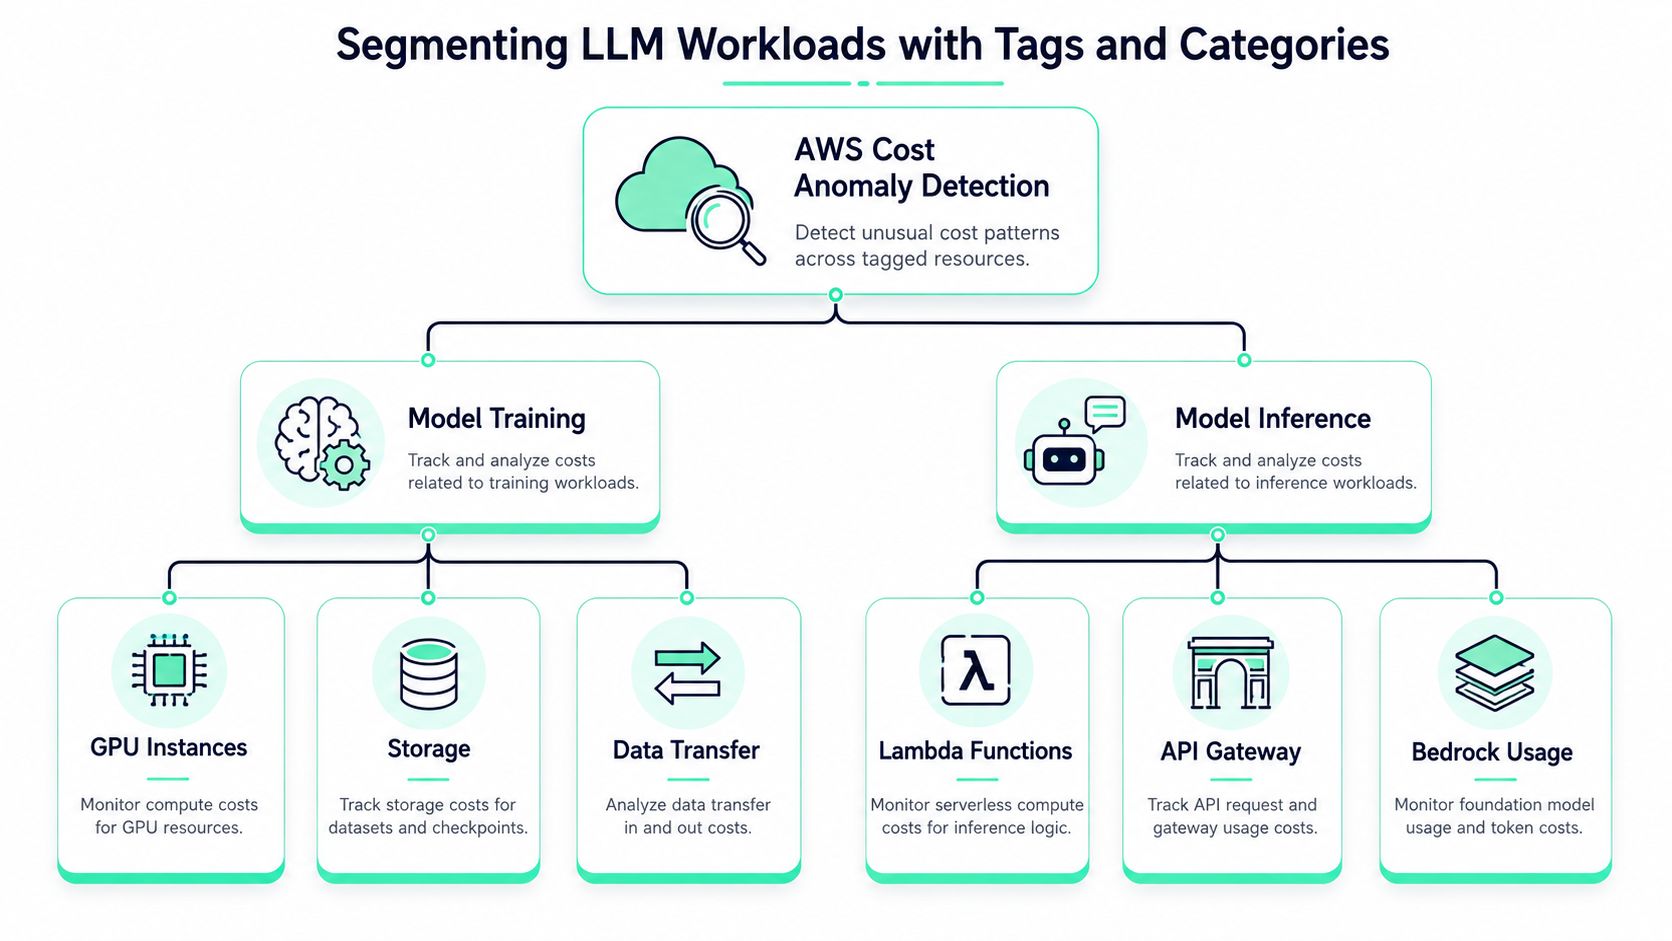
AWS supports segmentation by service, linked account, cost allocation tags, and cost categories. That lets a support assistant, a code generation tool, and a summarization service show up as separate lines of spend instead of one blended AI bill. The value is operational, not cosmetic. It gives FinOps and platform teams a way to isolate where the anomaly lives before they start digging through logs.
The tagging model has to reflect how your engineers work. If one team owns the prompt template and another owns the endpoint, tag both the workflow and the owning team. If you have experiments, tag them too, so a new model rollout does not look like a production regression when it is really a controlled test. In mixed-account environments, cost categories often help when account structure does not line up cleanly with product ownership.
Make instrumentation and AWS dimensions agree
AWS anomaly detection works best when the metadata behind the bill lines up with the metadata in the app. Application tags need to mirror the cost tags, or at least map cleanly to them, so an AWS alert can be traced back to the same feature name developers use in code reviews. Without that, the alert lands in one vocabulary and the incident lives in another.
A practical taxonomy usually includes team, feature, environment, and workload type. For LLM systems, that gives you a path from bill to code path. A model switch in the document summarizer should surface differently from a cache invalidation in the support bot, even if both use the same provider.
Practical rule: if your tags cannot answer “who owns this prompt,” they are not operational enough.
For teams that also need a broader cost lens, the same ownership logic applies to chargeback and reporting. Cost visibility only works when the organizational model and the technical model line up.
Wiring Alerts into Incident Workflows
An anomaly alert sitting in an inbox doesn't save money. It only matters when the alert reaches the same workflow your engineers already trust for production issues.
Route alerts where engineers already work
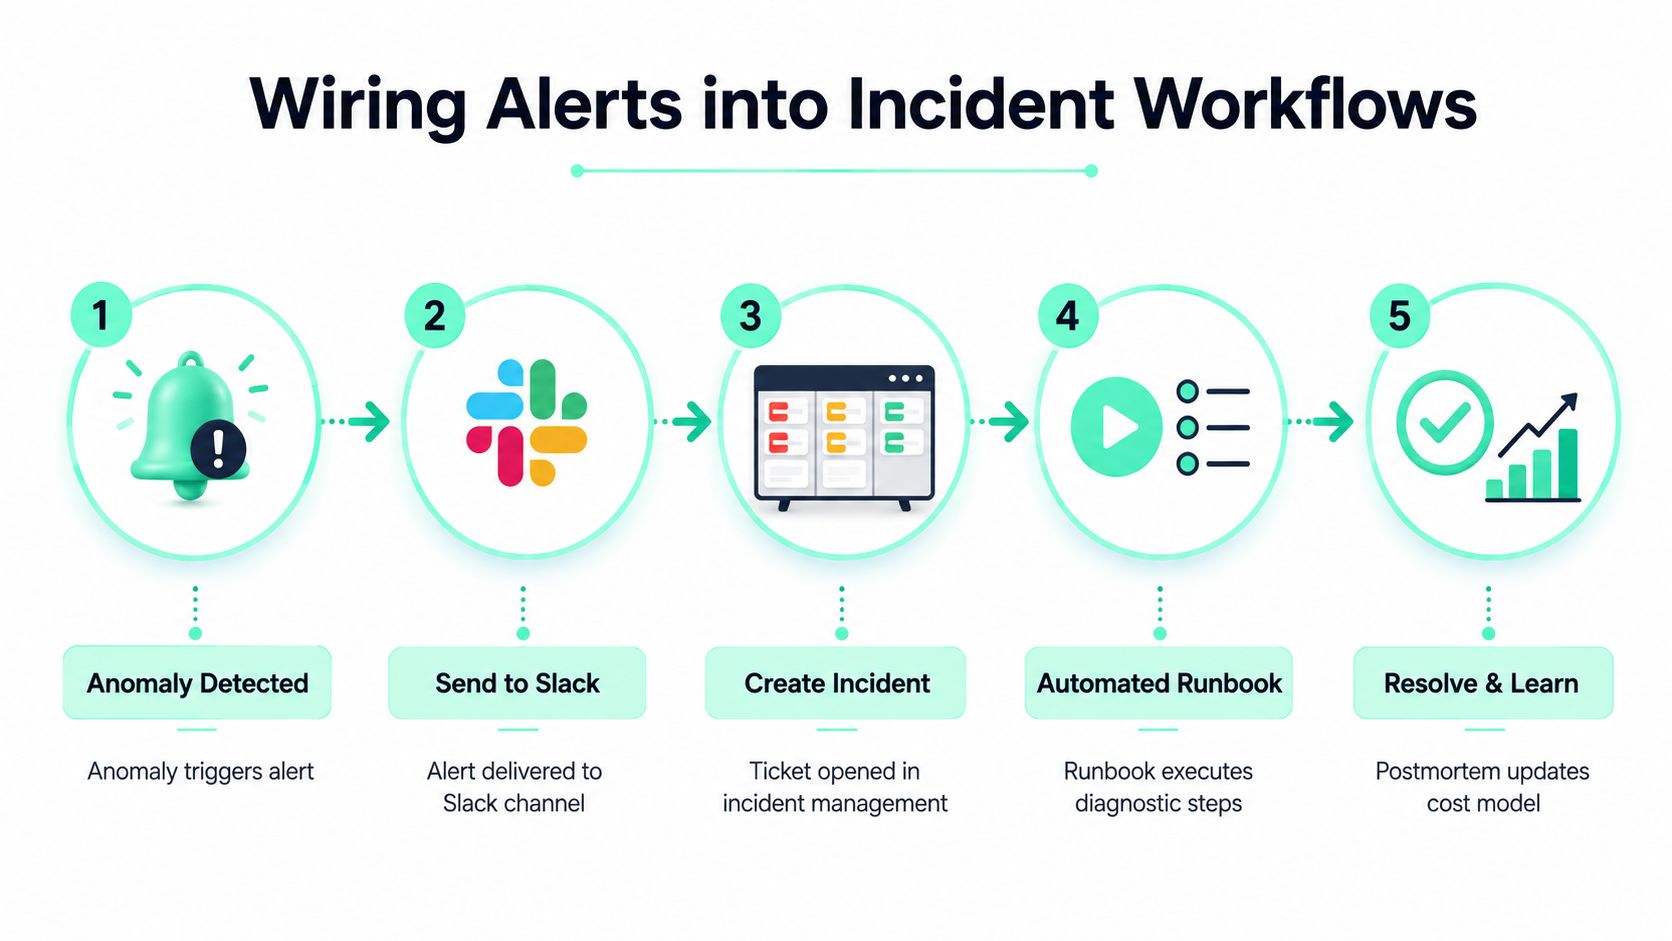
AWS's recent FinOps direction makes the workflow expectation pretty clear. The FinOps Agent announcement says cost anomalies can be investigated and routed into tools like Slack and Jira, and it describes a model where anomaly detection becomes part of continuous operations instead of a monthly review ritual AWS FinOps Agent preview. That lines up with how cost alerts should be treated, as operational events, not just billing notes.
For practical routing, an SNS topic is the simplest handoff point. Send high-severity anomalies to the on-call rotation, send medium ones to a shared FinOps channel, and keep low-signal events out of the pager path. If the alert volume is healthy, the on-call engineer should be able to tell, from the channel alone, which workload spiked and whether it's release-related.
Add context before the alert lands
The worst cost alerts are technically correct and operationally useless. A good notification should include the monitor scope, the cost impact, the expected versus actual spend, and the owner tag if you have one. If you're enriching alerts with Lambda, the function can pull in release metadata, model name, or prompt version from your internal systems before the message ever hits Slack.
A useful pattern is to treat the notification as a triage packet. The message should answer whether this is a sudden deploy-related spike, a steady rise from usage growth, or a likely model routing issue. If your workflow already uses CloudWatch dashboards, the alert can also link to the relevant anomaly history so the engineer can see whether it's a one-off or a repeated pattern.
Use incidents, not inboxes
If the anomaly affects customer-facing AI, open an incident. The value isn't in creating process theater, it's in shortening the path from detection to owner. A shared incident ticket also prevents the classic failure mode where three people assume someone else is watching the spend.
For AI systems, that closed loop matters because the fix is often small. A prompt template adjustment, a model fallback change, or a cache check can stop the bleeding quickly once the right person has context. Without that workflow, the alert gets read, acknowledged, and forgotten until the next billing surprise.
Investigating Root Causes with SpendLens AI
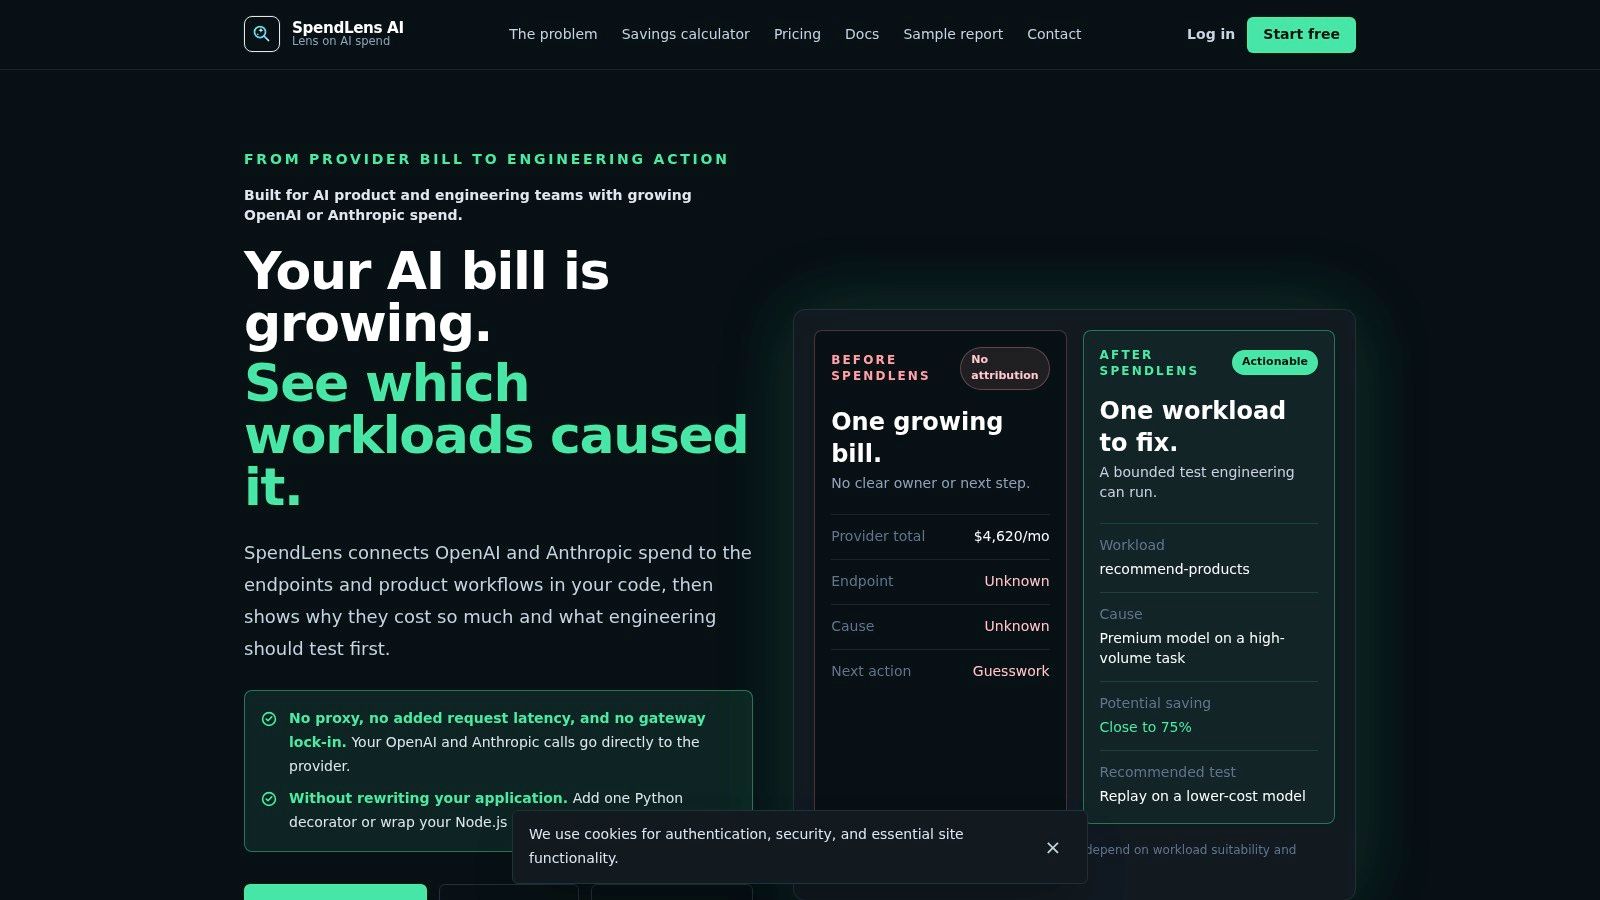
AWS will tell you a bill moved. The hard part is tracing that movement to a real LLM workload, then to the exact change that caused it.
Start with the three questions that matter
When an anomaly fires, engineers usually need three answers fast. What changed. Which workload is responsible. How do we fix it. AWS's own documentation makes clear that anomaly detection is the first step, while the newer AI-powered investigation direction suggests the root-cause layer still has to be handled separately AWS AI-powered cost investigations.
That separation is especially painful for LLM services. The same feature can move spend because a prompt got longer, a model got swapped, or a cache path stopped hitting. The bill doesn't tell you which of those happened, and the AWS anomaly page doesn't connect the alert to a specific code deploy or prompt template by itself.
Trace spend from model to workload
The useful root-cause workflow breaks spend down by project, provider, model, and workload. That lets you see whether the spike came from inference, training, a new prompt, or a model switch. Automated workload classification helps compare similar operations against each other so a support bot isn't judged against a batch summarizer, which would be a bad comparison from the start.
Prompt waste signals matter too. Large templates, excessive context, repeated instructions, and long outputs all inflate token consumption, and those patterns are easy to miss if you only look at aggregate bill totals. Cache-token usage is another important signal, because a cache that should be absorbing repeated requests but isn't can turn an efficient feature into an expensive one.
A realistic investigation path
Anomaly alert arrives for a document summarization feature. The breakdown shows the workload is still the same, but input token usage has jumped sharply. The code review history points to a new prompt template that now includes the full document instead of the intended summary context.
That's the kind of investigation that saves real money, because the fix is surgical. You roll back the prompt, verify the token profile, and stop the spend from compounding. It's a much better outcome than discovering the issue at month-end and reconstructing the cause from logs, invoices, and guesswork.
Practical rule: if the alert can't be tied to a prompt, model, or workload owner, the investigation isn't done.
For teams that want to compare anomaly data with historical spend exports, the operational companion is a CUR-style view of spend behavior. A good starting point is SpendLens AI's AWS Cost and Usage Report guide, because the deeper the cost data, the faster the root cause becomes obvious.
Remediation Patterns That Actually Save Money
Detection is only useful if it changes the next deploy. The most reliable savings come from removing avoidable token waste, steering traffic to cheaper models when the task allows it, and making cache behavior part of the optimization review.
Choose the cheapest model that still passes the job
A good remediation pattern is to compare the task, not the brand name. A classifier, a short-form extractor, and a long-context reasoning workflow do not need the same model. If your anomaly investigation shows a feature is using a high-cost model for a low-complexity task, the fastest savings usually come from a model switch with a tight validation plan.
Prompt trimming matters just as much. Removing redundant instructions, shrinking context, and tightening output formats often lowers token use immediately. Cache efficiency is the other lever people forget, because repeated prompts should not behave like fresh work every time.
Use remediation patterns that map to the cause
| Remediation Pattern | Typical Savings | Implementation Effort | Risk Level |
|---|---|---|---|
| Switch to a lower-cost model for simpler tasks | Potentially meaningful when the task is over-modeled | Moderate | Medium |
| Reduce prompt bloat and repeated instructions | Usually immediate once templates are cleaned up | Low to moderate | Low |
| Improve cache behavior and reuse | Better when traffic is repetitive | Moderate | Low to medium |
| Split workloads by function and owner | Better attribution and fewer noisy spikes | Moderate | Low |
| Add proactive anomaly monitors for prompt waste | Catches regressions earlier | Moderate | Low |
Fix the process, not just the spike
One team's best answer to a sudden cost rise may be to revert a prompt change. Another may need to move a workflow to a cheaper model or split a mixed endpoint into separate calls with different cost profiles. The point is to tie the fix to the failure mode, not to apply a generic “optimize AI” label and hope for the best.
If your team can't see cost recommendations alongside model, workload, and usage context, the remediation effort gets slower. That's why the useful savings conversation is about evidence, not intuition. A small engineering change can save money quickly when the wrong model or prompt shape is the actual cause, and the value compounds when those patterns are caught before they show up as anomalies.
Building a Proactive AI FinOps Practice
The first surprise bill usually starts with an AWS anomaly alert, then the work begins. The alert tells you spend moved, not which LLM workload changed, which prompt template drifted, or whether a model switch, cache miss, or burst in retries caused it.
Move from alerting to governance
AWS managed monitors, tags, and categories improve visibility, but visibility by itself does not give you control. The next step is connecting cost ownership to engineering ownership, so the person who changes a prompt, swaps a model, or widens a retrieval path sees the spend impact quickly. That is the line between a reactive bill chase and a working AI FinOps practice.
A practical maturity path starts with basic AWS anomalies, adds tagged attribution, then automated investigations, then proactive recommendations. Daily summaries let leadership track spend without asking engineers for ad hoc reports, and cross-model comparisons help teams place each workload where it belongs instead of defaulting to the model they know best.
Adopt the cost-allocation mindset early
Cost allocation works best when it is designed into the product from the start. Define ownership labels, decide which workloads need separate tracking, and make sure those labels survive releases, experiments, and provider changes. If you wait until the bill is already out of control, you end up reconstructing history from logs, deployments, and incomplete memory.
The better pattern is to make anomalies less likely before they hit the alert stage. That means cleaner tagging, clearer workload boundaries, and prompt reviews that treat cost impact as a standard check. It also means deciding which AI features deserve special monitoring before they become expensive surprises.
Practical rule: mature teams do not ask only “what did this alert cost,” they ask “what release process let this happen.”
For a deeper framework on ownership and reporting structure, the guide to SpendLens AI cost allocation methods is the right companion reading. The goal is not to collect more dashboards. It is to build a system where fewer surprises make it to the alert stage in the first place.