AWS Cost and Usage Report: A Complete Guide 2026
Learn how to set up the AWS Cost and Usage Report, query it with Athena, and attribute AI/LLM spend to specific workloads. See real savings examples.
Do not start looking for an AWS Cost and Usage Report until something goes wrong. A bill lands, AI spend is up, the finance team wants an explanation, and engineering can only say that “usage grew.” At that point, summary views and invoice totals are too blunt to answer the question, which feature, workload, or caller drove the cost.
That gap is exactly where AWS CUR earns its keep. AWS says CUR and CUR 2.0 provide “the most detailed information about your AWS cost and usage” and can be generated at hourly, daily, or monthly granularity, with fields such as blended cost and usage quantity for analysis. In practice, that line-item detail is what turns cloud spend from a finance artifact into something engineering can govern, allocate, and optimize with real confidence. AWS Cost and Usage Report documentation
Table of Contents
- What Is AWS Cost and Usage Report and Why It Matters for Attribution
- Key Components of AWS Cost and Usage Report
- Configuring AWS Cost and Usage Report
- Partitioning, Tagging, and Delivery Best Practices
- Querying CUR with Athena and Glue
- Attributing LLM Spend Using CUR Data
- Security, Retention, and Automation Considerations
What Is AWS Cost and Usage Report and Why It Matters for Attribution
Engineering teams typically discover the need for an AWS Cost and Usage Report only after a billing surprise. A product team ships a new AI feature on Monday. By Friday, the OpenAI or Anthropic line on the bill is noticeably higher, but no one can tell whether the spike came from summarization, chat, search, or a background job. A standard invoice cannot answer that question because it shows the total, not the source.
AWS Cost and Usage Report changes that because it is built for line-item-level attribution. AWS describes CUR as the most detailed billing dataset, with line items for each unique combination of product, usage type, and operation. That difference matters when the question shifts from “spend increased” to “this service, this account, this tag, this hour.” AWS cost management overview
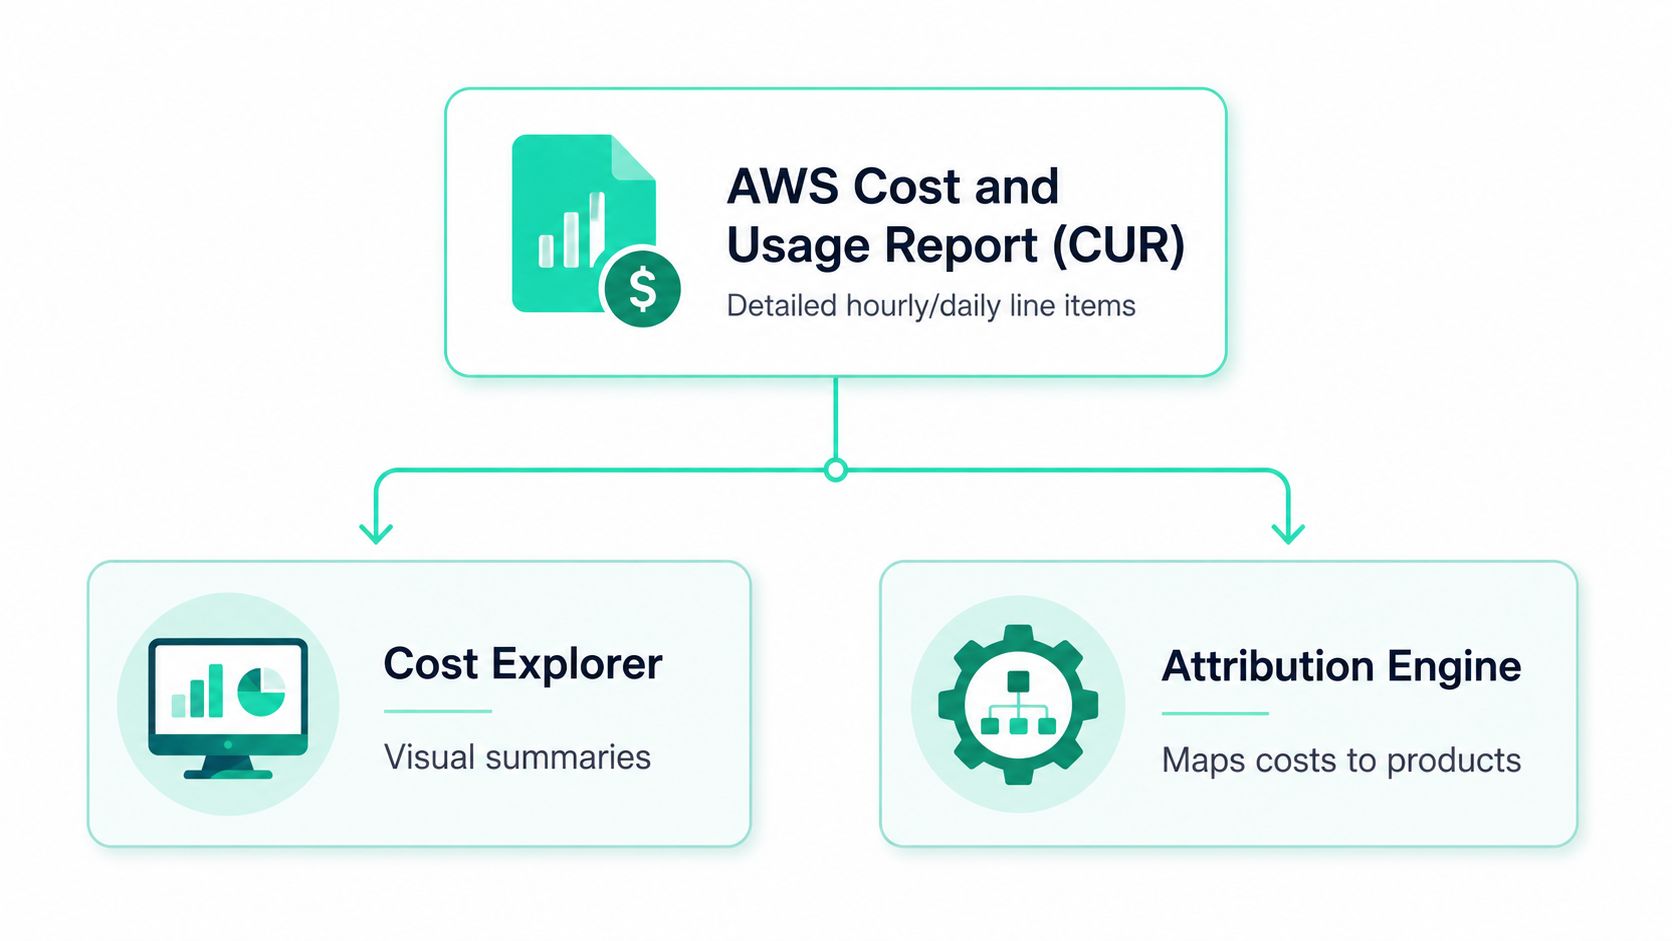
Why attribution teams keep coming back to CUR
Cost Explorer works well for quick summaries, but it is not the same thing as the underlying dataset. CUR is the source of truth when you need to reconcile spend across services, linked accounts, and time windows, especially for chargeback and showback. AWS also positions CUR as a single location for cost and usage information, including hourly or daily line items and activated cost-allocation tags, which makes it useful for account-level and IAM-user-level visibility rather than only service totals. AWS cost management overview
That detail matters when the question is not just “what did we spend?” but “who drove it?” The same dataset that lets a FinOps team attribute EC2 usage can also help engineering leaders trace AI feature usage, model choice, or prompt-heavy workflows back to a specific workload. For teams that want a ready-made example of that workflow, a sample SpendLens AI report shows how CUR-style data can support attribution without manual spreadsheet work.
Practical rule: if finance needs a number and engineering needs a reason, CUR is usually where the reason lives.
The trade-off is straightforward. CUR gives you depth, but depth without structure becomes noise. The rest of the work is making sure the report is configured, tagged, and queried in a way that lets you answer attribution questions quickly enough to change behavior.
Key Components of AWS Cost and Usage Report
CUR becomes useful when you work with it as a structured dataset. AWS documents that CUR 2.0 includes resource IDs, report versioning, and integration with Amazon Athena, Amazon Redshift, and Amazon QuickSight, which points to a design for downstream analytics as much as for billing review. AWS also describes CUR as a free reporting feature, with value coming from the detail it exposes across accounts, billing line items, reservations, pricing, products, and tags. CUR 2.0 overview
The fields that matter in real attribution work
Engineers rarely need every field equally. The ones that show up most often in practical analysis are the fields that identify who, what, when, and how much. That usually means the resource identifier, the usage type, the operation, the account, the time window, and the activated tags that tie the spend back to a team or workload.
A single request trace can move through several layers before it becomes a CUR row. A provider SDK call can be tagged at the application layer, a gateway or proxy can add metadata, and then the billing line item captures the cost event. If the metadata survives that path, you can ask which workflow drove the call or which feature generated the spend. If it doesn't, you are left with totals and guesswork.
For teams working with model APIs, the useful mapping is usually this:
- Provider or API metadata, for example workload, feature, endpoint, or caller identity.
- CUR line item fields, for example account, resource ID, operation, usage type, and tags.
- Attribution output, for example cost by feature, by team, by environment, or by customer-facing endpoint.
The internal demo report at SpendLens AI sample report shows how this data can be organized when the goal is to tie spend back to workloads instead of leaving it at service level.
What CUR can and can't tell you on its own
CUR is strong at showing line-item detail. It is weaker at showing business context unless you deliberately pass that context into the data model. That is why tags and resource IDs matter so much. If you only capture provider totals, you will know the bill changed, but not whether that change came from one feature or ten.
The practical decision for any FinOps or platform team is simple. Decide whether the report only records costs, or whether the dataset also explains them. CUR earns its value when you treat it as a structured dataset designed for downstream analytics, and that only holds if your tagging and delivery design support the questions you want to answer.
Configuring AWS Cost and Usage Report
A clean CUR setup starts with the questions you need the report to answer later. If you are attributing AI workloads, reconciling business-unit spend, or investigating hourly swings, hourly granularity gives you the most practical detail. If you only need month-end reporting, daily or monthly exports are lighter, but they leave less room to investigate spikes or map spend back to a specific workflow.
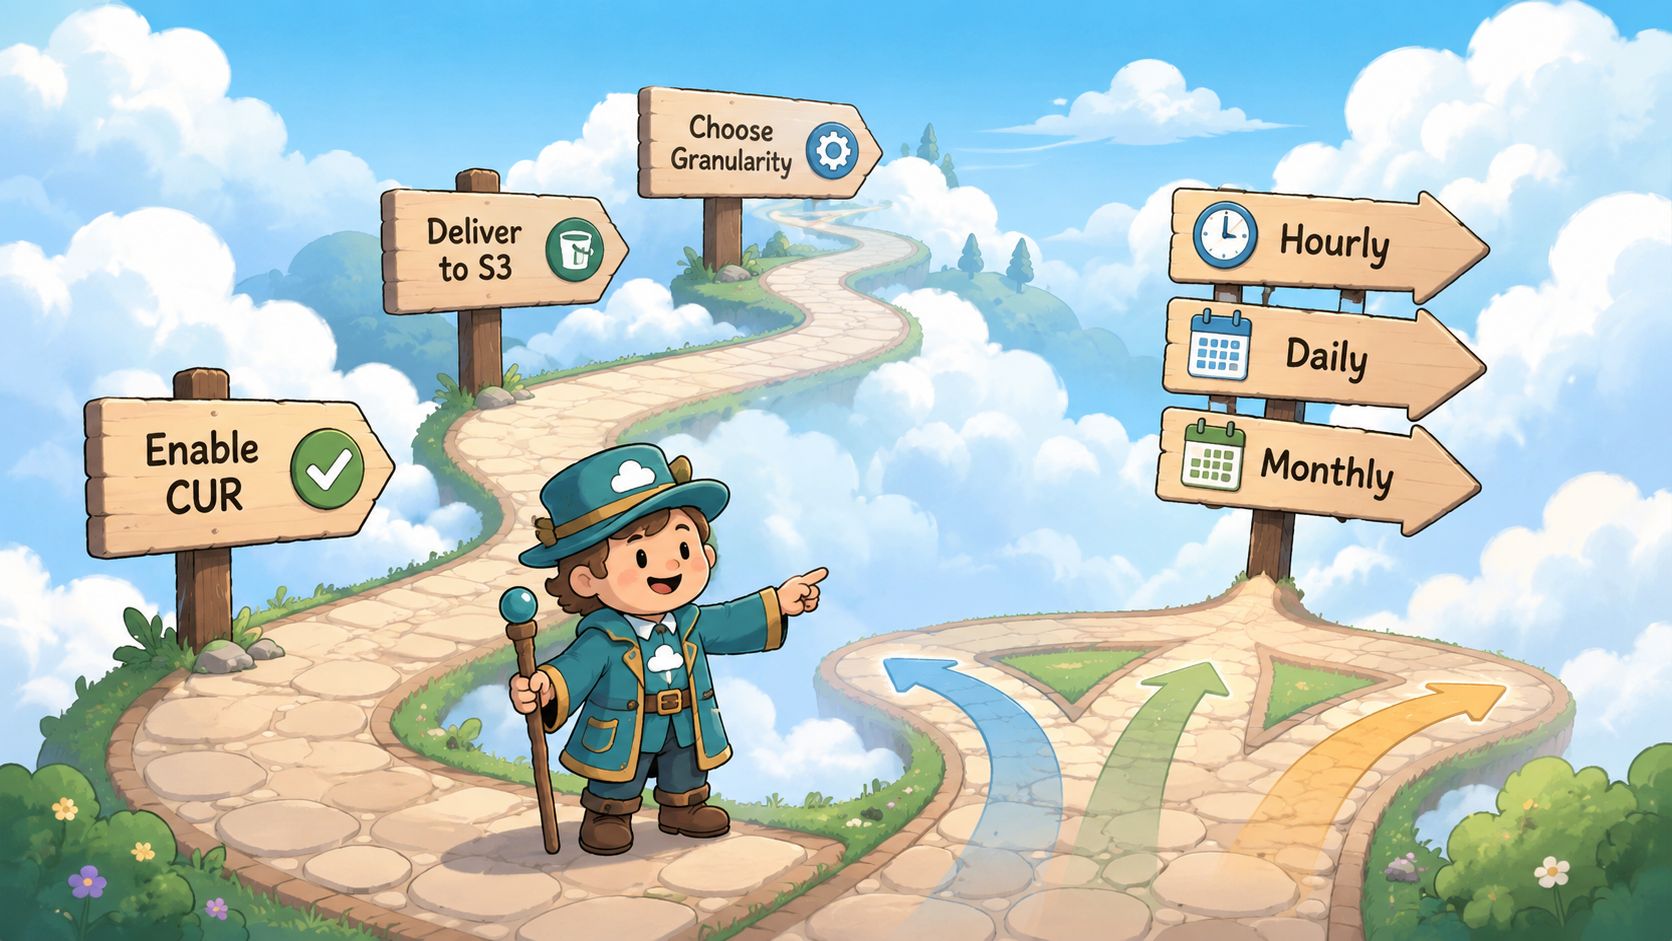
AWS documents that CUR can be generated at hourly, daily, or monthly granularity, and the API can be used to create, query, and delete report definitions programmatically. That is why many teams wire it into automated FinOps pipelines instead of managing it by hand. See the AWS CUR API reference and delivery setup guidance for the service behavior and configuration options.
A practical setup path
A practical setup usually follows the same sequence.
- Create the report definition in the Billing and Cost Management console or through the CUR API.
- Choose the delivery bucket in Amazon S3.
- Pick the granularity that matches your attribution needs.
- Enable cost-allocation tags that you want exposed in the report.
- Verify delivery and confirm the files arrive where your analytics layer expects them.
The API path matters because it reduces drift from manual changes. If the report definition lives in infrastructure-as-code or a scripted provisioning workflow, the delivery format, naming, and destination stay consistent across accounts and environments. That consistency matters the first time you compare one month to the next, or when you need to trace which AI feature introduced a spend change. For teams formalizing that workflow, the practical cloud cost management approach is usually easier to keep consistent than a spreadsheet-led process.
Operational insight: the fastest way to lose trust in billing data is to let three different teams define “the report” three different ways.
Granularity and downstream analytics
Hourly data is heavier, but it is far more useful when you are tracing an LLM feature launch, a compute spike, or a temporary reservation mismatch. Daily data gives you a middle ground for trend analysis. Monthly output works for executive summaries, but it is usually too coarse for attribution work.
A mid-size SaaS team I have seen move from manual reconciliation to CUR plus Athena cut its monthly cost review from six hours to under thirty minutes after enabling hourly delivery and building a repeatable query path. That kind of time savings usually shows up first in the hours the team gets back each month, not in the raw bill total.
Delivery checklist
- S3 destination locked down so the report lands in a controlled bucket.
- Granularity chosen intentionally, not by habit.
- Tags activated before expecting them in analysis.
- Versioning understood so report changes do not confuse comparisons.
- Query path ready through Athena or another analytics tool.
The image above works as a simple reference point. CUR is the source, but delivery determines whether the report becomes a durable analytics asset or just another file sitting in storage.
Partitioning, Tagging, and Delivery Best Practices
The biggest CUR failures I see are not caused by bad AWS data. They're caused by weak structure around the data. If the S3 layout is messy, the tags are inconsistent, or delivery health isn't monitored, the report becomes expensive to query and unreliable to trust.
What helps, and what hurts
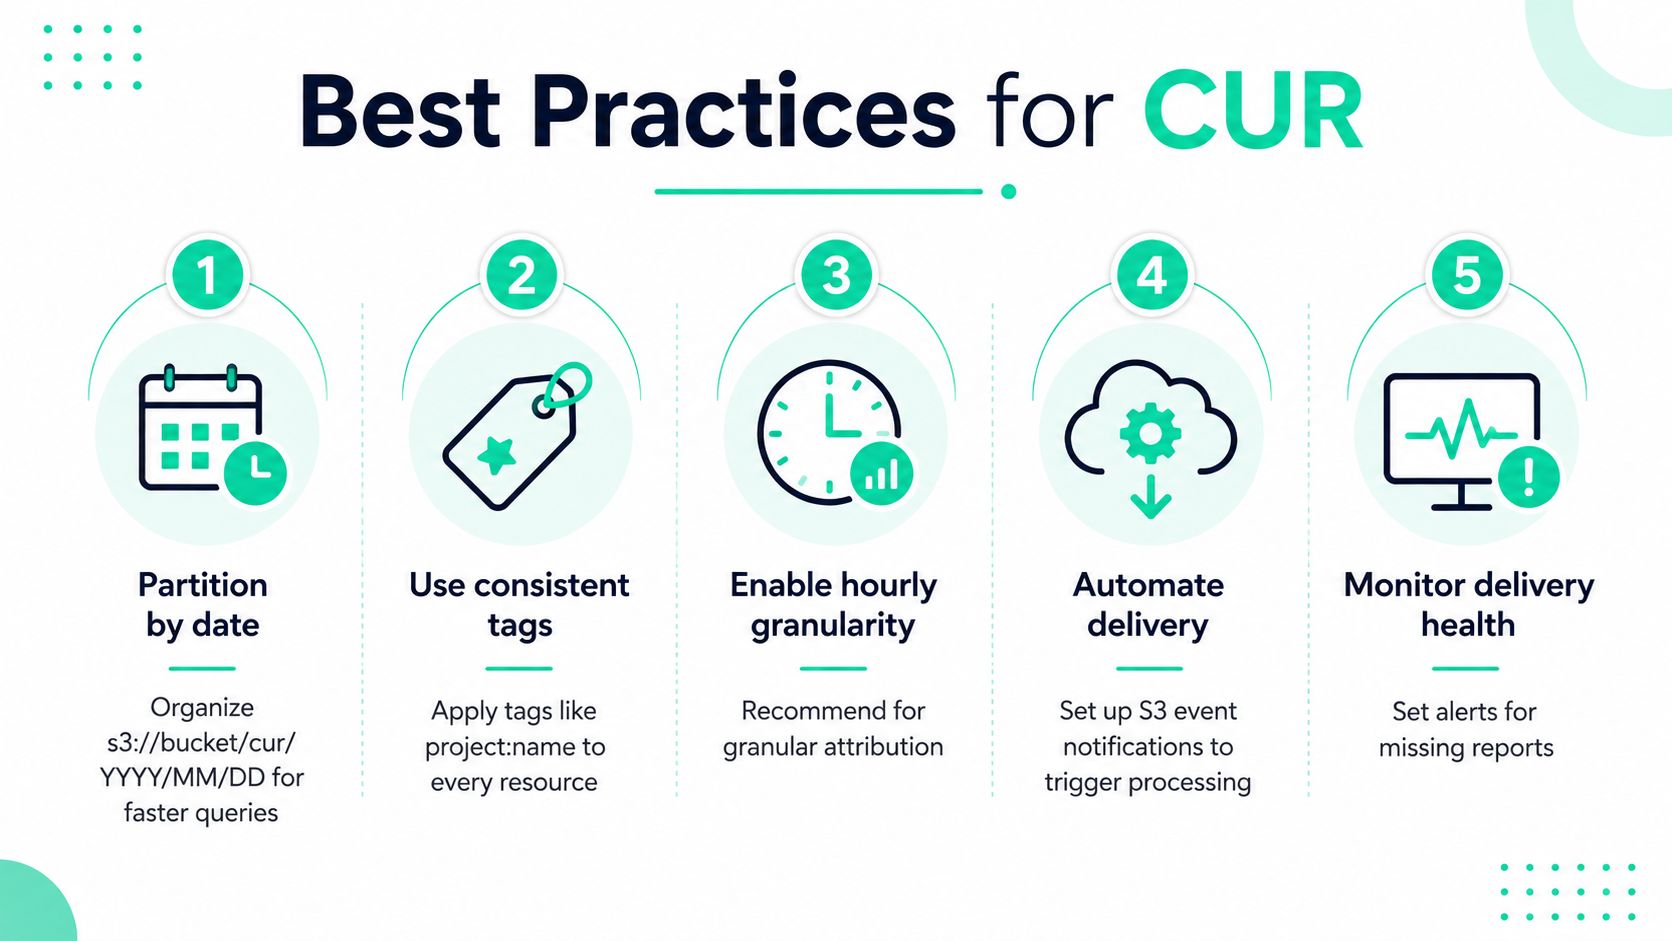
Partitioning by date is the easiest win. A layout such as s3://bucket/cur/YYYY/MM/DD keeps Athena scans more targeted, while an unpartitioned dump forces broader reads than you need. That matters most once the report starts covering multiple accounts or high-volume workloads.
Tagging discipline is even more important. If AI infrastructure is left untagged, chargeback conversations get stuck immediately because the report can't map spend back to a product, team, or feature with any confidence. Consistent tags like project:name or team:platform are far more useful than ad hoc labels that change from one deployment to the next.
Automated delivery also matters. When report ingestion is manual, missing files are often discovered only after someone asks why the numbers don't line up. S3 event notifications, validation jobs, and delivery alerts reduce that risk because they make the pipeline observable instead of implicit.
Prioritization when bandwidth is limited
If your team can only fix a few things first, do them in this order.
- Partition first: it gives you faster queries and less waste in Athena.
- Standardize tags next: without them, attribution stays fuzzy.
- Automate delivery after that: silent failures are painful and avoidable.
- Add health checks last: they catch drift before finance does.
A team trying to manage cloud cost manually will usually get faster value from this kind of structure than from more dashboards. The report itself does not need to be fancy. It needs to be predictable.
For a practical example of how that discipline fits into a broader cost workflow, the guidance at manage cloud cost with SpendLens AI pairs well with a CUR pipeline because it focuses on turning raw usage into decisions, not just charts.
Rule of thumb: if querying CUR feels slow, the problem is often the storage layout or tag hygiene, not Athena.
One more trade-off deserves attention. Cross-account reporting can simplify governance for large organizations, but it also raises the bar for permissions and bucket ownership. If you want clean attribution at scale, design the delivery path as deliberately as the report itself.
Querying CUR with Athena and Glue
Once CUR lands in S3, Athena and Glue are the usual path to usable answers. AWS documents CUR as working with Amazon Athena, AWS Glue, Amazon Redshift, and AWS QuickSight for querying, transformation, and visualization, which makes it a practical choice for teams that want SQL-based attribution before they move data into a separate warehouse. AWS CUR what is CUR, DevOpsSchool CUR guide
The query pattern that works
Good CUR queries are narrow, explicit, and a little tedious in the right way. They set the date range, charge type, grouping keys, and attribution dimensions before any aggregation happens. That keeps the numbers aligned and makes reconciliation with Cost Explorer less painful.
A practical pattern looks like this:
- Filter the period you care about.
- Choose the charge type you want to compare, often unblended or usage-only depending on the question.
- Group by the attribute that matters, such as tag, resource ID, or account.
- Aggregate costs and usage separately so you can see behavior, not just dollars.
AWS's guidance on reconciling Cost Explorer with CUR is useful here because many mismatches come from filters, charge types, time ranges, or aggregation settings, not from billing data that is somehow “wrong.” In practice, analysts often need to compare unblended costs, limit the charge type to Usage, and align date grouping exactly before totals line up cleanly. That is the part many setup guides leave out.
A SQL shape that answers real questions
A common query shape is:
- spend by account or tag for a given month
- resource-level spend for a workload investigation
- usage trend over time for a specific product code or operation
That structure is enough to answer questions like which team spent the most last week or how much a discount applied yesterday. It also surfaces Savings Plans discounts and makes underused reserved capacity easier to spot when you are looking for compute waste.
Practical insight: if a CUR query cannot be explained in one sentence, it usually is not ready for production use.
A recurring mistake is joining too much too early. Teams sometimes try to build a giant attribution view before they know which fields matter. That makes queries harder to maintain and usually slows the path to a number people trust. Start with one question, one filter set, and one business owner.
For teams deciding how far to push SQL-only attribution before adding a layer on top, cost allocation methods for AWS billing data is a useful reference point because it compares allocation models rather than treating every cost question the same way.
The payoff is real. Once the query path is stable, CUR stops being a reporting export and becomes a working dataset for FinOps, platform engineering, and workload owners.
Attributing LLM Spend Using CUR Data
LLM attribution is where CUR becomes more than a cloud-billing tool. The same structure that tracks infrastructure usage can also reveal which AI feature, model, workflow, or endpoint is driving spend, as long as the metadata makes it into the billing trail. AWS's newer Bedrock guidance shows the direction clearly, since CUR 2.0 can now record caller identity and principal tags directly for Bedrock API calls, which reduces the need for manual log reconciliation. AWS Bedrock principal-based cost allocation
Raw CUR alone versus enriched attribution
Raw CUR querying works when your metadata discipline is strong and your questions are narrow. You can trace costs by account, tag, resource ID, or principal, then build your own SQL around the data. That is useful when the team already has a clean tagging model and someone owns the queries.
The problem is that most LLM teams don't start there. They have multiple providers, different SDKs, gateway patterns, and product features that reuse the same model endpoint for different jobs. Without a dedicated attribution layer, the report collapses all of that into one spend total.
A simple schema can look like this:
- workflow, for example summarization or search
- feature, for example chat or document generation
- endpoint, for example customer support or internal tooling
- provider, for example OpenAI or Anthropic
- caller metadata, when the SDK or gateway preserves it into the cost data path
That's the basic bridge between provider calls and cost ownership. If the same metadata is available in CUR, the billing record stops being anonymous and starts being useful.
Where SpendLens AI fits
SpendLens AI is one way to do that attribution when you don't want to write Athena queries for every question. It adds lightweight instrumentation with @spendlensai.observe, track(), and client.tag() to map calls to workflows, tasks, features, experiments, or endpoints, then breaks spend down by project, provider, model, and workload. It's also built to ingest a customer-owned CUR export, which is relevant when you want the AWS bill and the LLM runtime view to line up in one operating model. SpendLens AI cost allocation methods
A team I've seen wrestle with this pattern initially only knew that monthly OpenAI spend was $18,000. That number was real, but it was not actionable, because no one could tell which feature drove it. After instrumenting workload attribution, the team found that one summarization workflow accounted for 41 percent of that spend and could be moved to a lower-cost model for an estimated $6,300 monthly saving. Those are the kinds of savings that change prioritization quickly.
When to use SQL and when to use a platform
Use raw CUR queries when the question is one-off, the dataset is already clean, or the investigation needs full transparency. Use a platform when the attribution problem repeats across products, providers, or teams, and when the hidden cost is engineer time, not just spend.
Good split: CUR for billing truth, a platform for repeatable workload attribution.
The practical advantage of a purpose-built layer is not that it replaces CUR. It's that it keeps teams from reinventing the same joins and tagging rules every month.
Security, Retention, and Automation Considerations
A lot of teams assume CUR is “done” once the files are landing in S3. That's not true. The report is only as reliable as the bucket policy, retention setup, tag discipline, and validation pipeline wrapped around it.
AWS's own security-oriented guidance shows how much signal exists in CUR, from unusual region usage to data transfer anomalies and extended support charges, but those detections only work when the report is delivered consistently and queried safely. The same is true for attribution. If delivery is delayed or tags go missing, your cost model gets shaky fast. AWS CUR security blog
Security and retention basics
The S3 bucket receiving CUR should be treated like billing infrastructure, not a scratch bucket. Lock down write access, limit read access to the teams that need it, and make sure retention rules fit your audit and cost requirements. Long retention helps investigations and trend analysis, but it also creates storage overhead, so lifecycle policies are worth setting early.
Automation helps with both visibility and trust. Lambda-based triggers can kick off validation when new files land, and CloudWatch alarms can alert you when spend crosses a threshold or when a delivery pattern looks wrong. That is much better than waiting for a finance review to uncover the problem.
Common issues that slow teams down
- Missing tags: usually a governance problem, not a billing problem.
- Delayed delivery: often looks like a data issue, but it's frequently an ingestion or permission issue.
- Reconciliation mismatches: usually come from filter differences, date grouping, or charge type choices.
- Empty reports: often mean the export exists but the downstream pipeline doesn't have the right access.
I've seen teams save twelve hours per month by automating CUR validation, mostly because they stopped manually checking whether the files arrived and matched expectations. That kind of win is boring in the best way.
If you're using a cross-account setup, verify the billing account, the export configuration, and the analytics permissions together. If you're attributing LLM usage, keep in mind that the quality of the attribution is only as good as the metadata your SDK or gateway preserves. For teams using API access for automation, the API keys guidance is part of making sure the ingest and tracking layers stay maintainable.
CUR is a strong foundation, but it doesn't magically solve attribution by itself. You still need disciplined tags, a reliable delivery path, and either a solid Athena practice or a dedicated attribution layer to make the data operational.
If you're trying to connect AWS spend, LLM workloads, and chargeback in one view, SpendLens AI can help you instrument calls, ingest CUR data, and attribute costs by workflow, feature, or model. Visit SpendLens AI to see how it fits into a CUR-based FinOps workflow and start turning billing data into decisions.