How to Manage Cloud Cost Without Killing Performance
Learn how to manage cloud cost with proven FinOps practices for monitoring, attribution, rightsizing, and LLM spend optimization.
The most expensive cloud bills usually don't come from bad pricing, they come from good infrastructure pointed at the wrong outcome. That's why the fight is not “cut the bill,” it's manage cloud cost in a way that ties every dollar to a product, feature, customer, or workload owner, because the cloud market still wastes 30% to 35% of spend on average according to the 2026 estimate cited here, which it translates into roughly $200 billion to $250 billion in annual global waste and $723 billion in cloud infrastructure spending in 2025, rising to more than $840 billion in 2026 (cloud cost statistics 2026). For AI-heavy teams, that waste often hides in compute, inference, and storage decisions that look fine in a dashboard but never trigger action.
Table of Contents
- Why Manage Cloud Cost Is Really About Outcomes, Not Just Bills
- Building the Visibility and Tagging Foundation
- Where the Money Actually Goes in AI-Heavy Stacks
- Detecting and Reversing Cost Anomalies Before the Invoice
- Rightsizing, Tiering, and Commitment Discounts That Actually Pay Off
- Cutting LLM and Inference Spend With Model and Prompt Choices
- Forecasting, Budgeting, and Your 90-Day Implementation Checklist
Why Manage Cloud Cost Is Really About Outcomes, Not Just Bills
Lowering cloud spend is not the same as improving cloud economics. A team can cut 12% from a bill and still make the business worse if that reduction comes from a workload that was carrying revenue, retention, or latency-sensitive user experience. The better frame is simple, every dollar should map to a product, feature, customer, environment, or business unit, and someone should feel accountable when that spend rises.
That's why the first three metrics that matter are allocation coverage, unit cost, and forecast accuracy. Allocation coverage tells you how much spend is tied to an owner or business dimension. Unit cost shows what one request, one job, one feature, or one outcome costs. Forecast accuracy tells finance whether the plan is real or just a retrospective cleanup exercise.
Practical rule: dashboards don't save money, owners do. If spend is visible but nobody has to answer for it, you've built a reporting layer, not a management system.
Mature teams shift from cost cutting to cost engineering. They stop treating cloud spend like a monthly surprise and start treating it like telemetry, the same way they already handle latency, error rates, and uptime. That matters even more for AI-heavy SaaS products, because inference can look like a small line item right up until a feature launch, a prompt change, or a new workflow pushes it into the top tier.
A common failure mode is cutting the wrong thing. A team may remove what looks like waste, then discover they just reduced capacity for a revenue-generating feature or made support workflows slower. In practice, the cheaper configuration is only a win if it preserves the right outcome, and that's the standard worth using from day one.
Building the Visibility and Tagging Foundation
Cloud cost programs break when the data layer is messy. Raw billing exports are useful, but they're not enough on their own, because finance can't act on a blob of spend that isn't normalized to business dimensions. The practical sequence is to build a single normalized cost table, then map costs to team, product, feature, customer, and environment, and only then decide who owns what.
Start with a small enforced tag schema
A FinOps-friendly setup doesn't need a giant tagging policy. It needs a small one that gets enforced at deploy time. A common pattern is five fields, application, environment, owner, cost_center, and service, with a rule like no tag, no deploy so chargeback and showback work across accounts and platforms (cloud cost management workflow). That kind of guardrail matters more than a giant taxonomy nobody fills out correctly.
| Tag Field | Example Value | Purpose | Owner |
|---|---|---|---|
| application | checkout-api | Connect spend to the product surface | Product engineering |
| environment | production | Separate prod from non-prod economics | Platform team |
| owner | payments-team | Assign accountability for action | Engineering manager |
| cost_center | cc-2041 | Support chargeback and budgeting | Finance ops |
| service | inference-worker | Tie spend to a runtime or workload | Service owner |
For services that call OpenAI or Anthropic, lightweight instrumentation helps close the loop. A decorator such as @spendlensai.observe or a track() call can attach workflow or endpoint context to each request without rewriting provider clients, so call-level cost lands in the same attribution model as cloud spend. In practice, that's what keeps inference from becoming an invisible side channel.
A useful reference for allocation methods is the SpendLens AI cost allocation guide, especially if your team already has multiple accounts or business units arguing over who owns the same cluster.
What good looks like by the end of week one
A clean setup doesn't need perfection to be useful. It needs enough coverage that leadership can see unowned spend instead of average noise.
- Tagged spend by owner: every top workload has a named owner, not a generic platform bucket.
- Unowned spend surfaced: anything without an owner gets reported upward, not hidden inside a blended average.
- Call-level AI attribution: model calls carry workflow or feature tags, so product teams can see the cost of specific usage.
- One reporting layer: finance, engineering, and product read the same normalized data, not three disconnected exports.
The goal is not pretty dashboards. The goal is to make it impossible for spend to exist without accountability.
Where the Money Actually Goes in AI-Heavy Stacks
Once attribution works, the bill stops looking abstract. In many stacks, compute accounts for 30% to 50% of total cloud spend, and AI-heavy organizations can see inference APIs and GPU instances reach 15% to 25% of total spend and grow faster than other categories. That pattern shows why cloud cost reviews need to separate classic infrastructure waste from inference waste instead of pushing both into the same bucket.
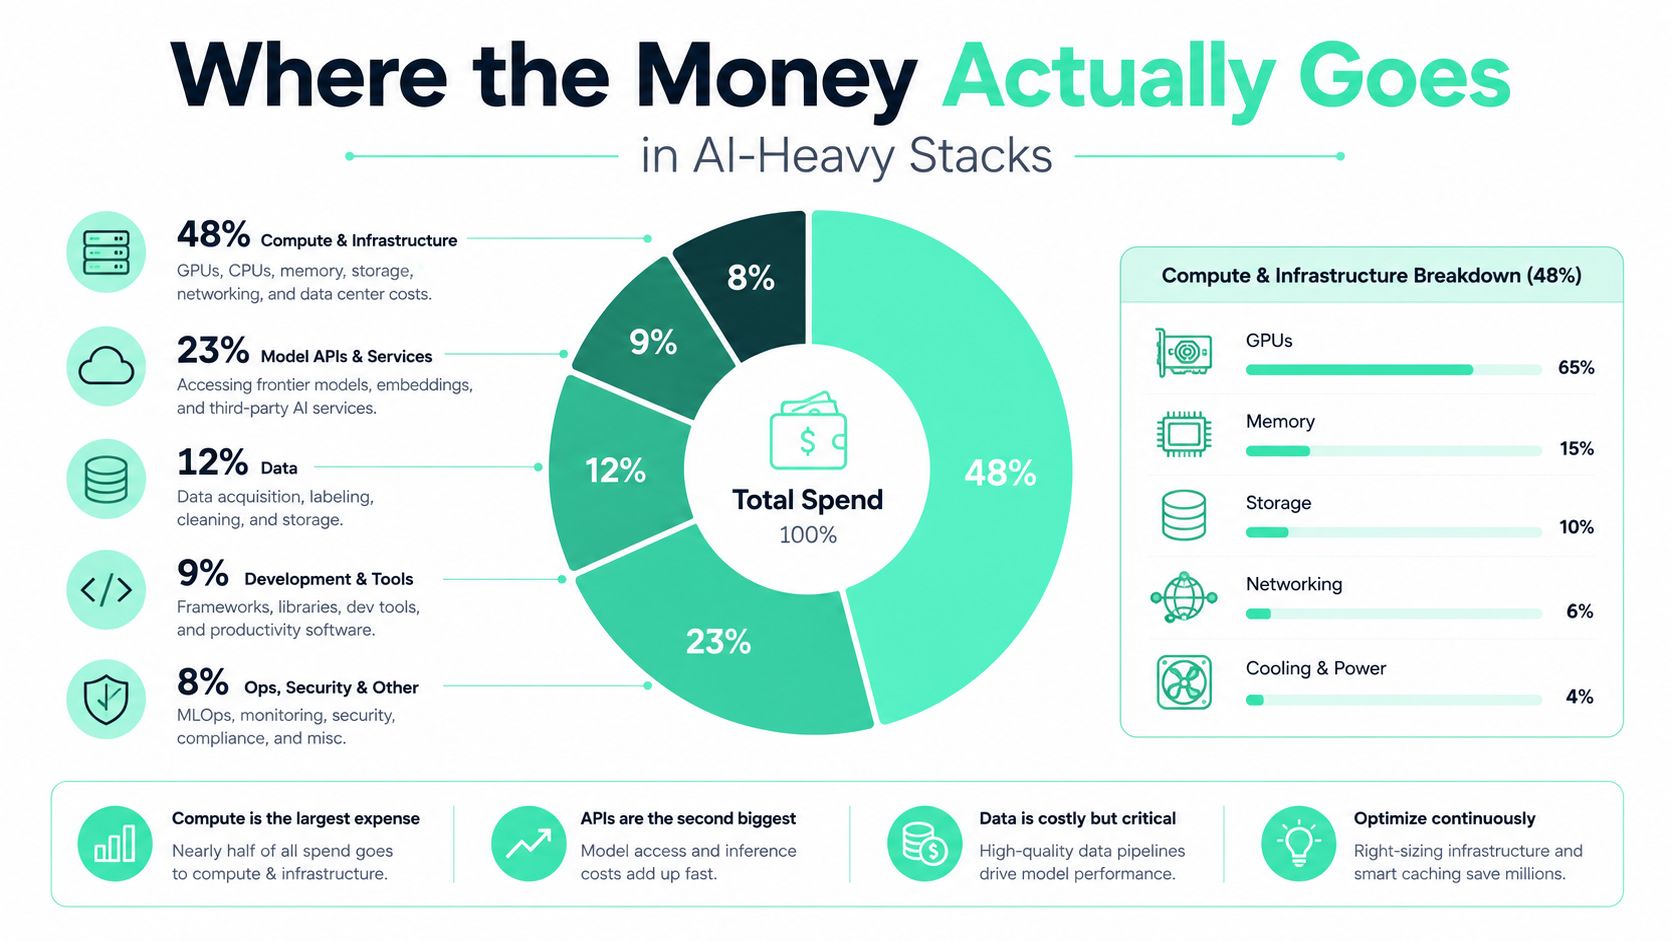
The older waste patterns are easy to recognize, idle VMs, over-provisioned databases, and storage that never got tiered down. The newer ones are quieter. Prompt bloat, repeated boilerplate, oversized models on simple tasks, and missed cache hits can all raise inference cost while infrastructure dashboards still look healthy. That is why AI spending needs its own operational lens, one that sits beside compute, storage, and networking instead of hiding inside them.
A storage line can be large and still be boring. An inference line can be smaller and still be the one that grows fastest.
A 15-minute self-audit
Start with your top three spend categories and ask two questions for each. First, who owns it. Second, does it directly support revenue, retention, or a critical internal system. If the answer to either question is vague, that is your review queue.
A common discovery is that engineering teams focus on the loudest line item and miss the one that is compounding. A team may spend weeks arguing over a storage slice that looks high, only to find the main risk is an inference line nobody had been watching, especially after a feature launch or prompt revision. That shift in attention is often where the first real savings come from.
The embedded video below is useful if you want to show the difference between broad cloud spend categories and the smaller, fast-moving AI-specific ones.
For teams that want a cleaner operational view of request-level behavior, the endpoint monitoring guide shows how to tie traffic patterns back to the workloads that are driving cost.
Detecting and Reversing Cost Anomalies Before the Invoice
Dashboards tell you what already happened. Anomaly detection tells you what is happening before finance finds it. That difference matters, because the worst cloud conversations usually start with a line like, “How did our bill triple this month?”
A team I've seen handle this well didn't wait for invoice day. They wired alerts to three signals, spend jumps on a single model, token volume spikes tied to one feature, and cache hit-rate drops after a prompt change. When their retrieval pipeline went live, calls climbed 4x within 48 hours, and the root cause turned out to be a verbose system prompt duplicated on every call. The fix reclaimed roughly 38% of that workload's spend in under a week because the team routed the alert to the workload owner instead of a generic cost channel.
Set thresholds that match the workload
Good anomaly rules use more than one threshold. Absolute alerts catch obvious spikes. Percentage-of-baseline alerts catch growth that still looks “normal” in raw dollars. Per-workload thresholds catch the one service that's drifting while the rest of the fleet is fine.
The signals worth wiring up are usually the same across SaaS teams:
- Cache hit rate, because falling cache efficiency often means prompt shape changed.
- Prompt template size, because template creep is one of the easiest ways to waste tokens.
- Top spender delta, because a workload that suddenly climbs deserves immediate review.
- Token volume by feature flag, because releases often explain cost drift better than infrastructure does.
Route alerts to owners, not inboxes
A generic cost Slack channel gets ignored. A message sent to the team that owns the workload gets triaged. That sounds obvious, but many programs stop at notification without establishing who has to act.
For endpoint-level patterns and alerting structure, the SpendLens AI endpoint monitoring guide is the closest thing to a practical blueprint. It's useful because it treats cost signals like operational signals, not accounting trivia.
The goal is not more alerts. The goal is fewer surprises, and faster root-cause analysis when a deployment changes the economics of a workload.
Rightsizing, Tiering, and Commitment Discounts That Actually Pay Off
The savings here are still real, but only if the workload profile is understood first. Start with actual utilization over a representative period, because averages hide idle windows and short spikes. A workload can look fine in a dashboard and still be oversized for most of the month.
Capacity optimization asks what the machine can do. Cost optimization asks what the workload actually needs, then pays for that, and no more.
Classify workload stability before buying discounts
Commitment programs usually fail for one reason, teams buy reserved capacity before they know the demand shape. Reserved and committed-use discounts are commonly reported to save 30% to 75% versus on-demand pricing when workloads are stable enough to justify the lock-in (cloud cost optimization techniques in 2026). Reserve the predictable baseline, then leave bursty demand on elastic pricing or autoscaling.
Storage needs the same discipline. Moving infrequently accessed data to lower-cost tiers can reduce storage expense by 50% to 70% (cloud cost optimization techniques in 2026). That is one of the few areas where policy can lower spend without changing product behavior.
A practical pattern from the field is straightforward. Pausing unused cloud services such as RDS, Redshift, or Azure dedicated SQL pool compute resources, then automating shutdowns on a daily schedule, reduces waste fast in non-production environments (Infosys cloud cost optimization guide). The work is operational, not glamorous, and it usually pays back because the instances were already sitting there doing nothing.
A simple order of operations
- Measure actual usage, not inferred usage from a dashboard.
- Right-size to the workload objective, not to worst-case fear.
- Tier storage by access pattern, then let lifecycle policies move cold data down.
- Reserve only the stable baseline, after you've classified demand volatility.
- Automate shutdowns for idle services, especially in dev, test, and non-prod.
Choosing a virtual machine instance that meets basic workload requirements efficiently can produce monthly savings of up to 70% according to the Infosys guidance, but that figure only matters if the smaller footprint still passes performance testing. I would rather leave a bit of headroom than buy a discount that forces a rollback two weeks later.
For teams running API-heavy applications, the same discipline applies to the control plane. A service built on the OpenAI Completions API cost model and usage patterns should be reviewed against request shape, not just host size. If the request volume is stable but the payload is bloated, infrastructure savings will be minor and the fix sits in the workload design.
Cutting LLM and Inference Spend With Model and Prompt Choices
Reserved instances don't touch API bills, and that's why AI FinOps looks different. For LLM workloads, model choice and prompt shape are the equivalent of rightsizing. A team spending five figures a month on OpenAI and Anthropic won't get there by chasing idle disks, because the waste often sits in tokens, template growth, and using a flagship model for routine tasks.
Prompt waste is usually structural
The usual culprits are boring and expensive. Large system templates accumulate over time, few-shot examples multiply, boilerplate gets copied into every call, and outputs run longer than the task really needs. None of that shows up as a headline failure, but it changes unit economics fast.
The practical move is to set a target for prompt reduction and treat it like any other optimization backlog. If a support summarization flow doesn't need the full instruction stack from launch week, trim it. If a retrieval workflow is sending repeated context on every request, compress it. If cache opportunities are being missed, fix the prompt shape before touching the provider.
Don't let prompt growth become cultural drift. Every extra instruction has a cost, and most teams stop seeing it after the third or fourth revision.
Compare model choices like a workload decision
The right lower-cost alternative depends on quality thresholds, routing risk, and migration effort. That's where cross-model recommendations become useful, especially when they compare options across OpenAI, Anthropic, Gemini, Qwen, Mistral, DeepSeek, and Llama families with estimated savings and migration risk ratings. One place that surfaces this type of analysis is SpendLens AI's OpenAI completions guide, since it focuses on the mechanics of calls that carry real spend.
A realistic example is a support summarization workflow moved from a flagship model to a smaller one after quality checks cleared a defined threshold. The migration stayed low risk, and prompt cleanup improved cache behavior enough to matter operationally. That's the kind of change that reduces spend without forcing product teams to rewrite the whole service.
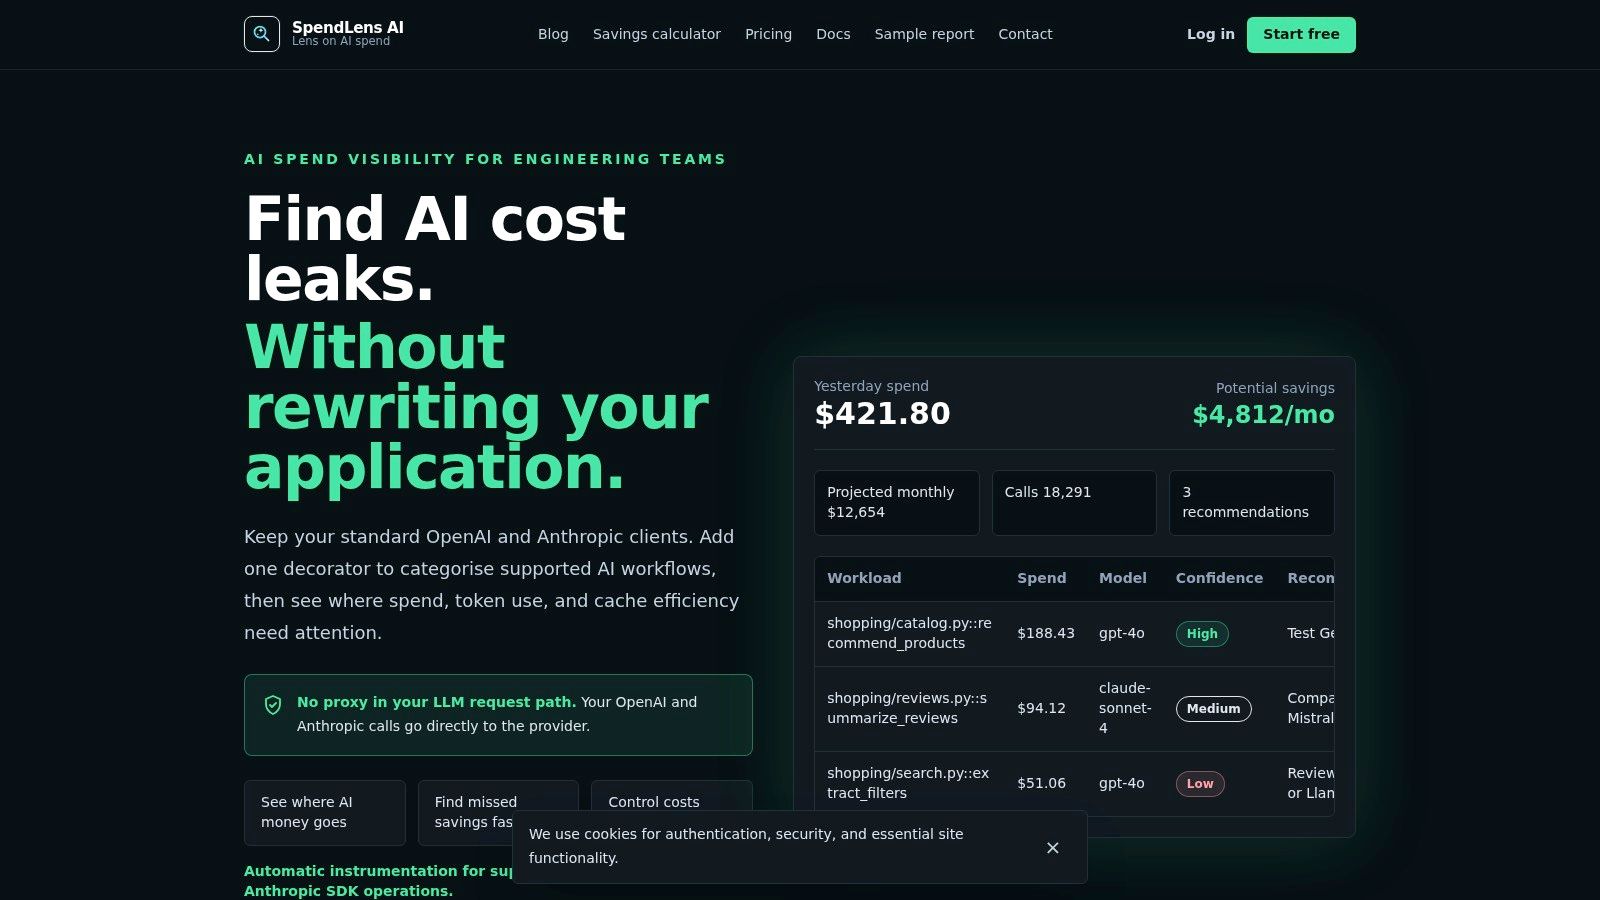
The right test queue is usually short. Start with high-volume, low-complexity tasks, compare quality against a hard acceptance threshold, then measure whether the cheaper model reduces cost per successful request. That's the only comparison that matters.
Forecasting, Budgeting, and Your 90-Day Implementation Checklist
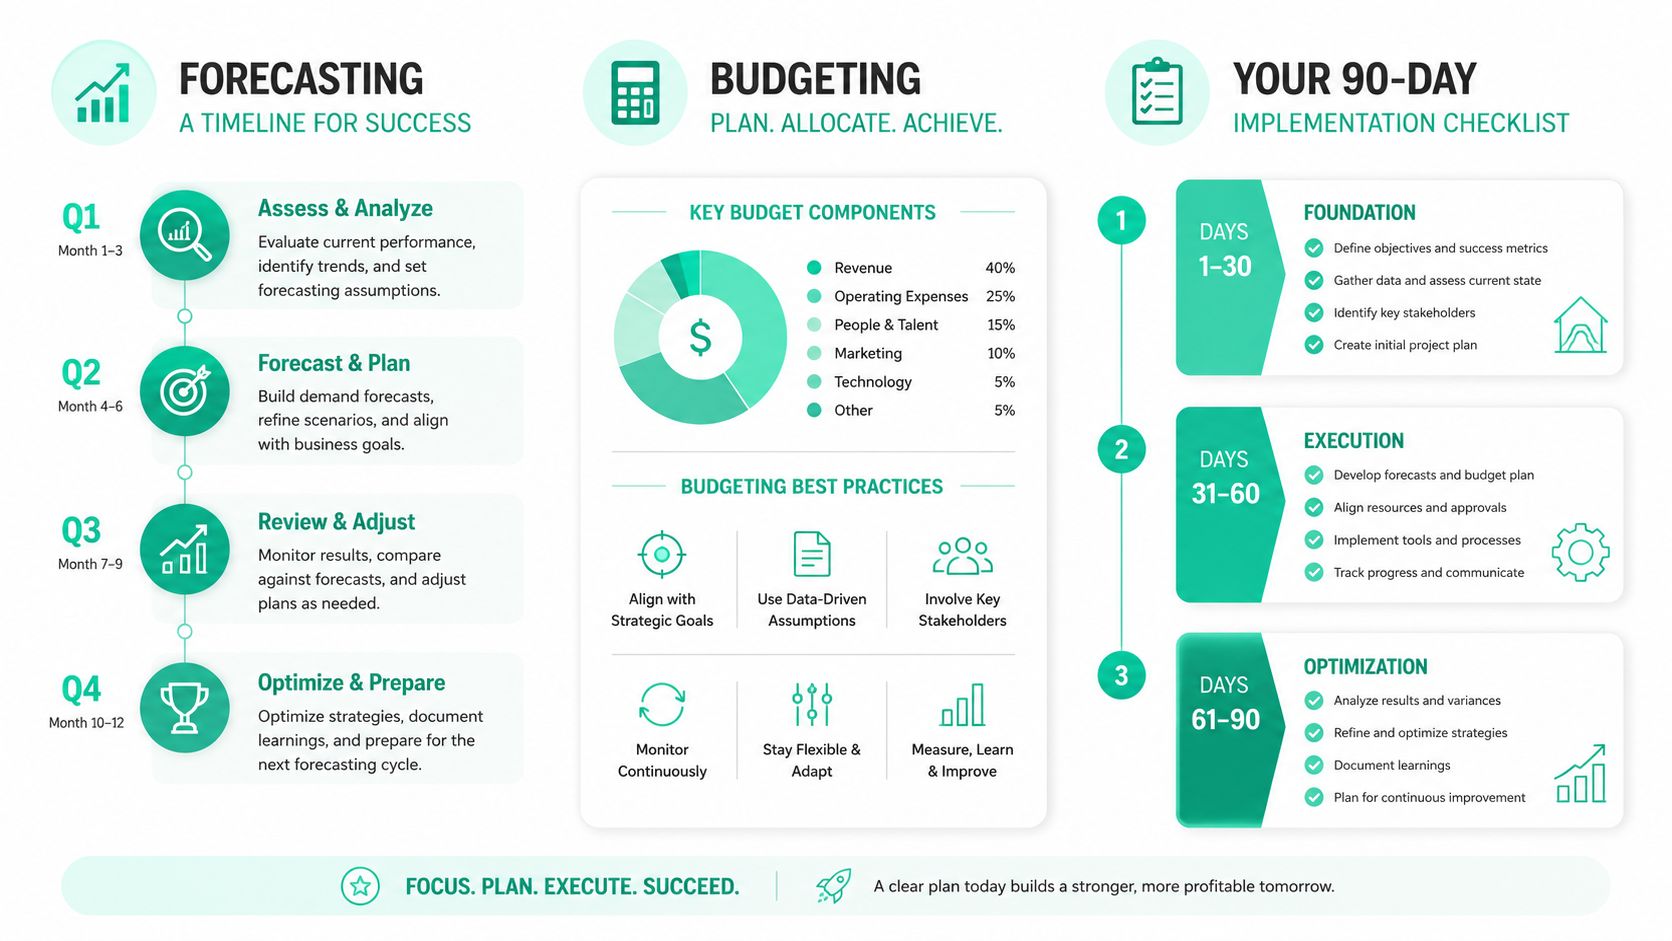
Finance does not need another prettier dashboard. It needs a forecast it can defend, and that starts with tagged traffic and unit-cost trends. Build the next-month forecast from those inputs, then compare forecast to actual every week so the miss stays small and the fixes stay specific. KPMG's FinOps guidance makes the same point in a different language, spend management should improve predictability, not just reduce spend, and it should connect ownership and reporting to business units and decisions (KPMG FinOps imperative).
A 90-day plan that ships
- Weeks 1 to 4: get normalized cost data, enforce the tag schema, and expose unowned spend.
- Weeks 5 to 8: right-size obvious waste, classify workload stability, and make commitment decisions only on predictable baselines.
- Weeks 9 to 12: roll out LLM-specific attribution, prompt cleanup, model comparison, and executive reporting.
The reporting cadence should stay simple. A daily summary with yesterday's spend, top cost driver, and highest-impact recommendation usually beats a sprawling dashboard no one opens. If tagging coverage stalls around 60%, stop adding more tags and fix the deploy path, because weak enforcement is usually the blocker.
The shift that matters is from reactive cost cutting to predictable cost engineering. Once ownership, unit cost, and forecasting are in place, the bill stops being a surprise and starts becoming a managed input.
If you want a faster path to that operating model, use SpendLens AI to instrument LLM calls, attribute spend to workflows and features, and surface model-switch opportunities, cache efficiency, and daily executive summaries in one place. For teams trying to reduce monthly bills, the value is in connecting spend to the work that created it, then pushing a recommendation someone can act on. It fits the gap most cloud cost programs miss, the space between visible spend and actual action, especially in OpenAI and Anthropic-heavy stacks.