
Endpoint Monitoring for LLM Workloads: A Practical Guide
Design endpoint monitoring for LLM workloads: track tokens, latency, and costs with Spendlens AI integration examples.
Your AI usage probably looks healthy in the provider dashboard, then the invoice lands and nobody can explain why a few workflows took over the spend. The team sees total tokens, maybe some latency, but not which feature, customer tier, or prompt shape drove the bill up. That's the point where endpoint monitoring stops being a device-security term and becomes a practical observability layer for LLM work, because it ties each call to the business context that paid for it.
The operational reality is simple. Aggregate spend is not enough when one endpoint powers a fast, cheap support flow and another powers a long, expensive summarization path. In a system like this, the same token volume can still produce very different costs depending on model choice, cache behavior, prompt structure, and whether the request was really worth sending at all. The better mental model is to treat endpoint telemetry as the cost ledger behind the AI feature, not just a health panel for the service.
Table of Contents
- Why Your AI Bill Keeps Surprising You
- Designing an Endpoint Naming and Tagging Strategy
- Instrumenting Your LLM Calls with Minimal Code Changes
- The Metrics That Actually Drive Cost Decisions
- Setting Up Alerts That Catch Spend Spikes Early
- Turning Monitoring Data into Cost Savings
- Privacy-First Monitoring Without Compromising Visibility
Why Your AI Bill Keeps Surprising You
The common failure pattern is painfully familiar. A product team ships a prompt change, support volume rises, or a new “helpful” feature gets turned on for a broader audience, and the next provider invoice arrives far above plan. The dashboard shows totals, but not the feature trail that led there, so finance asks for an explanation engineering can't produce with confidence.
That's where endpoint monitoring earns its keep. In practice, it turns each model call into an attributed event, so the cost line isn't just “LLM spend,” it's spend by feature, workflow, customer segment, or release train. A useful way to think about it is the same way SREs think about service telemetry, the request matters, the path matters, and the context matters.
The reason this is hard is that AI cost rarely scales in a straight line. A shorter prompt can still be expensive if it hits the wrong model, while a verbose prompt can be cheap if it runs through a lower-cost workflow and caches well. That's why aggregate billing views are useful for accounting, but weak for root-cause analysis.
A more useful frame is attribution. If you can connect every request to a project, environment, and business purpose, you can sort noisy “AI bill surprises” into real drivers, like a new onboarding feature, a higher-cost model class, or a prompt template that stopped reusing cached context. The result is less guesswork when leadership asks why spend moved and which changes mattered.
The same logic applies whether you're watching device telemetry or LLM telemetry. Proofpoint's monitoring view is built around continuous operational context, with fleet-level CPU, memory, and activity summaries plus per-device drill-downs and last-24-hour signals in the detail panel, which is a good analogy for LLM observability because broad rollups only become useful when paired with drill-downs on the exact entity under review (Proofpoint endpoint monitoring view). That pattern is also why teams working at scale should stop asking only “What did we spend?” and start asking “Which endpoint created the spend, and what business action caused it?” For a useful companion perspective on hidden usage, see why invisible AI usage creates surprise bills.
Practical rule: if you can't tie a spike to a release, workflow, or cohort within minutes, your monitoring is still too coarse.
Designing an Endpoint Naming and Tagging Strategy
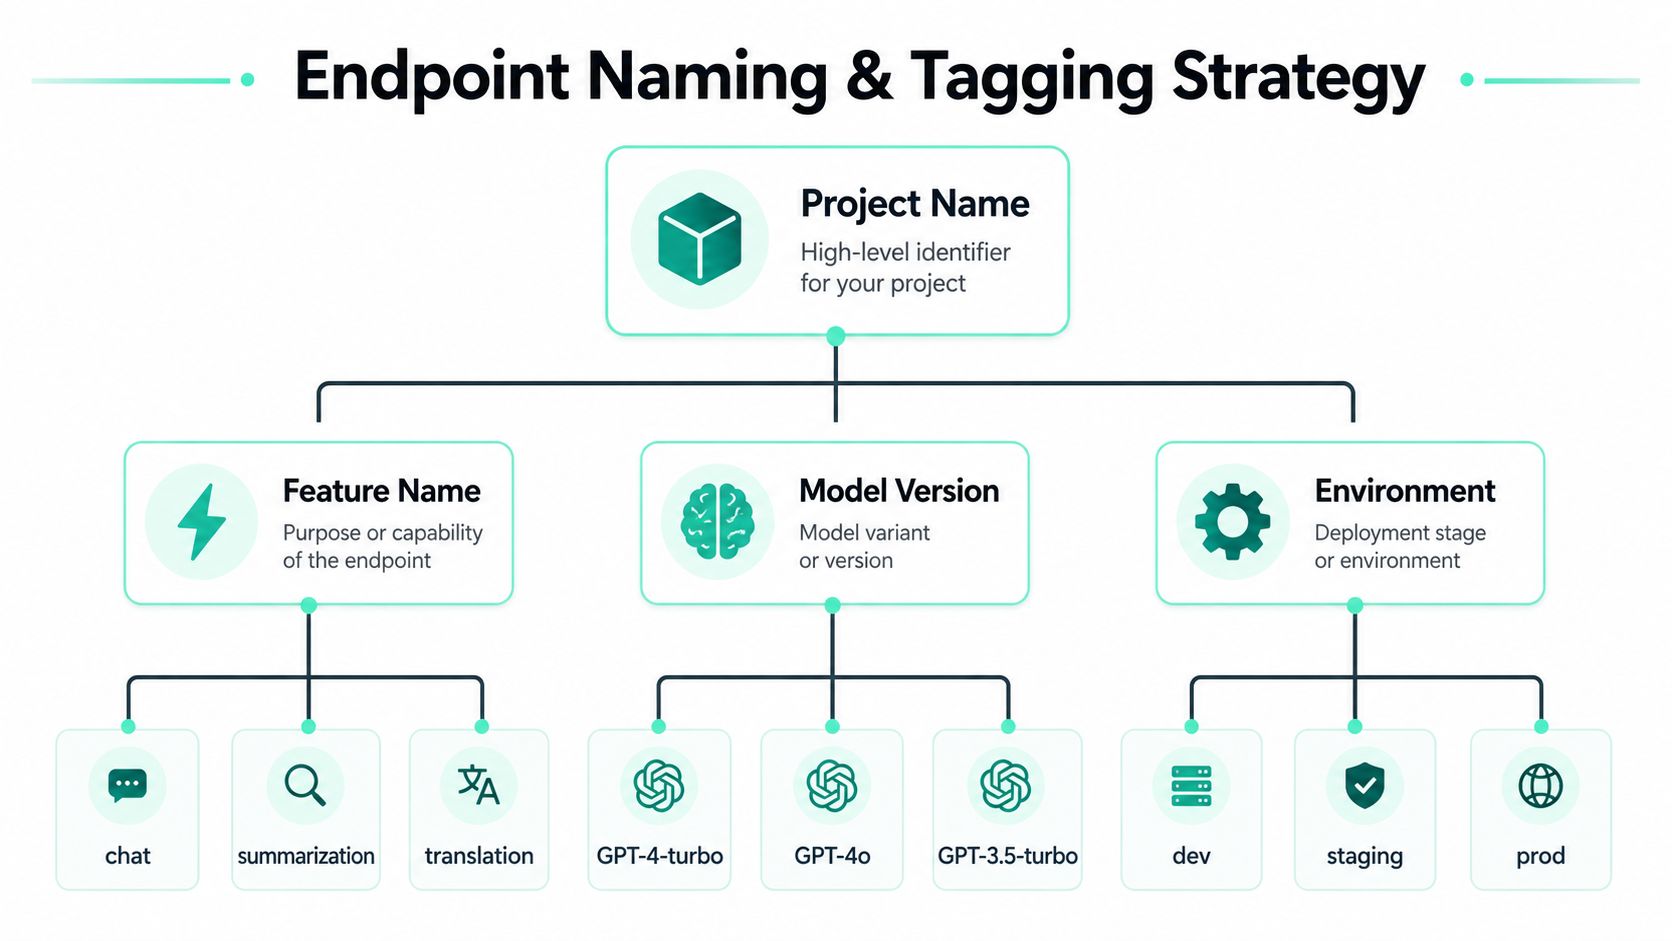
A naming scheme has to survive growth, or it turns into a graveyard of unlabeled requests. Flat labels like chat or summary look tidy at first, then collapse as soon as multiple teams, models, and environments share the same code paths. The fix is to give every endpoint a structured identity that mirrors how the business consumes the feature.
Start with the project and feature boundary
A good default is a hierarchical label that reads like a sentence, for example, project:search-assistant/feature:query-expansion/env:production. That gives you a stable top-level bucket for finance, a workable unit for engineering, and a clean separator between test traffic and production traffic. If a team can't explain what one identifier means in plain English, the label is too vague.
The next layer should reflect the workflow, not just the API route. A route named /chat/completions doesn't tell you whether it powers onboarding copy, internal research, or a customer-facing support bot. A workflow tag does, and that's the difference between a dashboard that looks busy and one that answers useful questions.
Add cross-cutting tags only where they change decisions
Tags like environment, customer tier, experiment cohort, and cost center are worth adding because they let you compare like with like. A production endpoint for enterprise customers can't be interpreted the same way as a staging endpoint for internal QA, and an A/B test cohort shouldn't pollute baseline reporting. The point is not to tag everything forever, it's to make the tags useful enough that people trust them.
A simple decision tree helps:
- If the request maps to one product area, use a project tag.
- If multiple workflows share the same endpoint, add a feature or workflow tag.
- If finance needs chargeback or showback, add cost center or customer-tier tags.
- If the same code runs in multiple environments, tag them separately, always.
If a tag won't change a decision, don't force it into the identifier set.
The practical outcome is attribution that survives reorgs and refactors. When a product manager asks why one workflow costs more than another, you want to answer with a search over structured tags, not with a Slack thread full of guesses.
Instrumenting Your LLM Calls with Minimal Code Changes
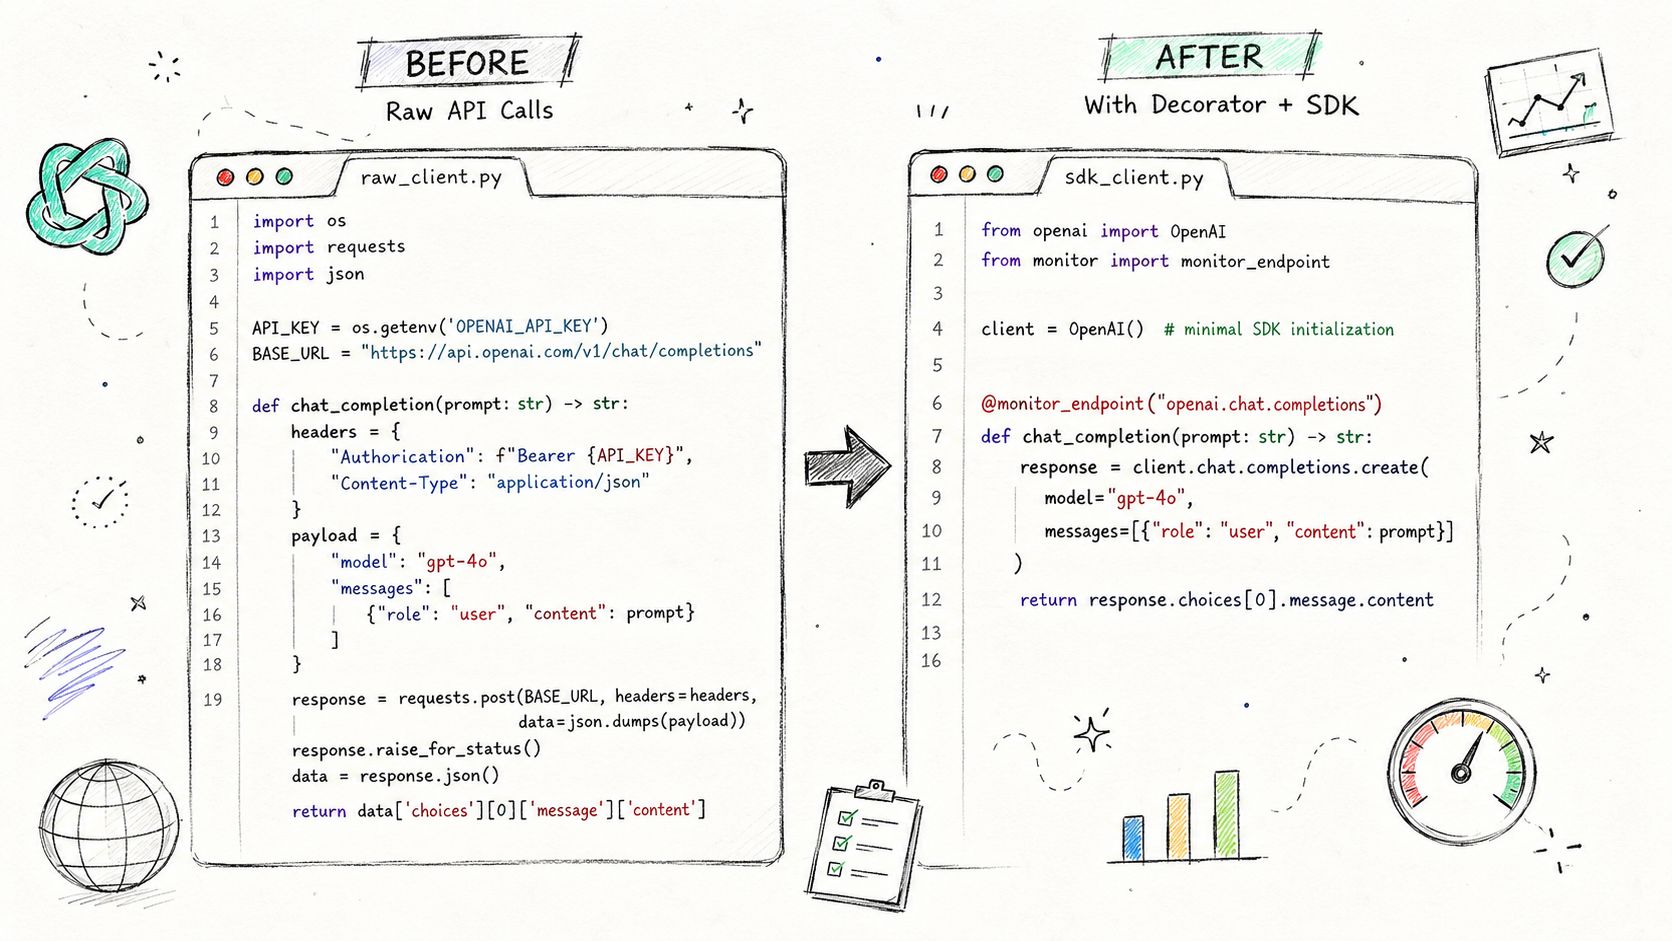
The least painful rollout is the one that doesn't make you rewrite client code. If your OpenAI or Anthropic calls already work, don't replace the SDK, don't add a proxy in the request path, and don't trade away your retry logic just to get telemetry. Wrap the existing calls, preserve behavior, and attach context at the edges.
A decorator pattern is the cleanest place to start. You keep the normal client flow, then annotate the function that already represents the business operation. That lets you instrument both sync and streaming paths without forcing every developer to learn a new abstraction before they can ship.
For example, a raw call can stay structurally the same while the wrapper captures workflow context, feature name, and environment. The important part is that attribution happens outside the model call itself, so existing error handling and retries still behave the way the application expects.
from spendlensai import observe

@observe(project="search-assistant", feature="query-expansion", env="production")
def expand_query(client, prompt):
    return client.responses.create(
        model="gpt-4o",
        input=prompt,
    )
That pattern scales because the function name becomes a semantic boundary. You can instrument chat completions, embeddings, and function-calling code the same way, then let tags distinguish which branch of the workflow ran. Streaming responses still fit, because the wrapper only needs to mark the request and capture metadata, not consume the stream itself.
A short rollout plan usually works best:
- Wrap the highest-cost paths first. Start with the endpoints already responsible for visible spend.
- Tag by workflow before model. Model labels matter, but workflow labels explain business value faster.
- Keep request content out of the default payload. Metadata is enough for attribution in most cases.
- Verify coverage in production. If a route still escapes instrumentation, fix that before adding more tags.
Later in the request flow, keep the code path boring. The best monitoring setup is the one the team forgets about because it doesn't break retries, doesn't add noticeable latency, and doesn't require a separate client abstraction to maintain.
This is the same operational discipline used in endpoint telemetry systems generally. The monitoring layer should observe the request path, not reshape it, which is why continuous observation is more reliable than periodic sampling when the goal is attribution rather than a rough estimate. For a closer look at implementation details, the embedded video below shows a practical workflow.
The Metrics That Actually Drive Cost Decisions
The mistake many teams make is treating token count as the whole story. Tokens matter, but they don't tell you whether the request was efficient, whether caching helped, whether latency is drifting, or whether the endpoint is becoming more expensive to serve. The useful set is smaller than most dashboards suggest, and it's more decision-oriented.
Focus on the metrics that connect cost to behavior
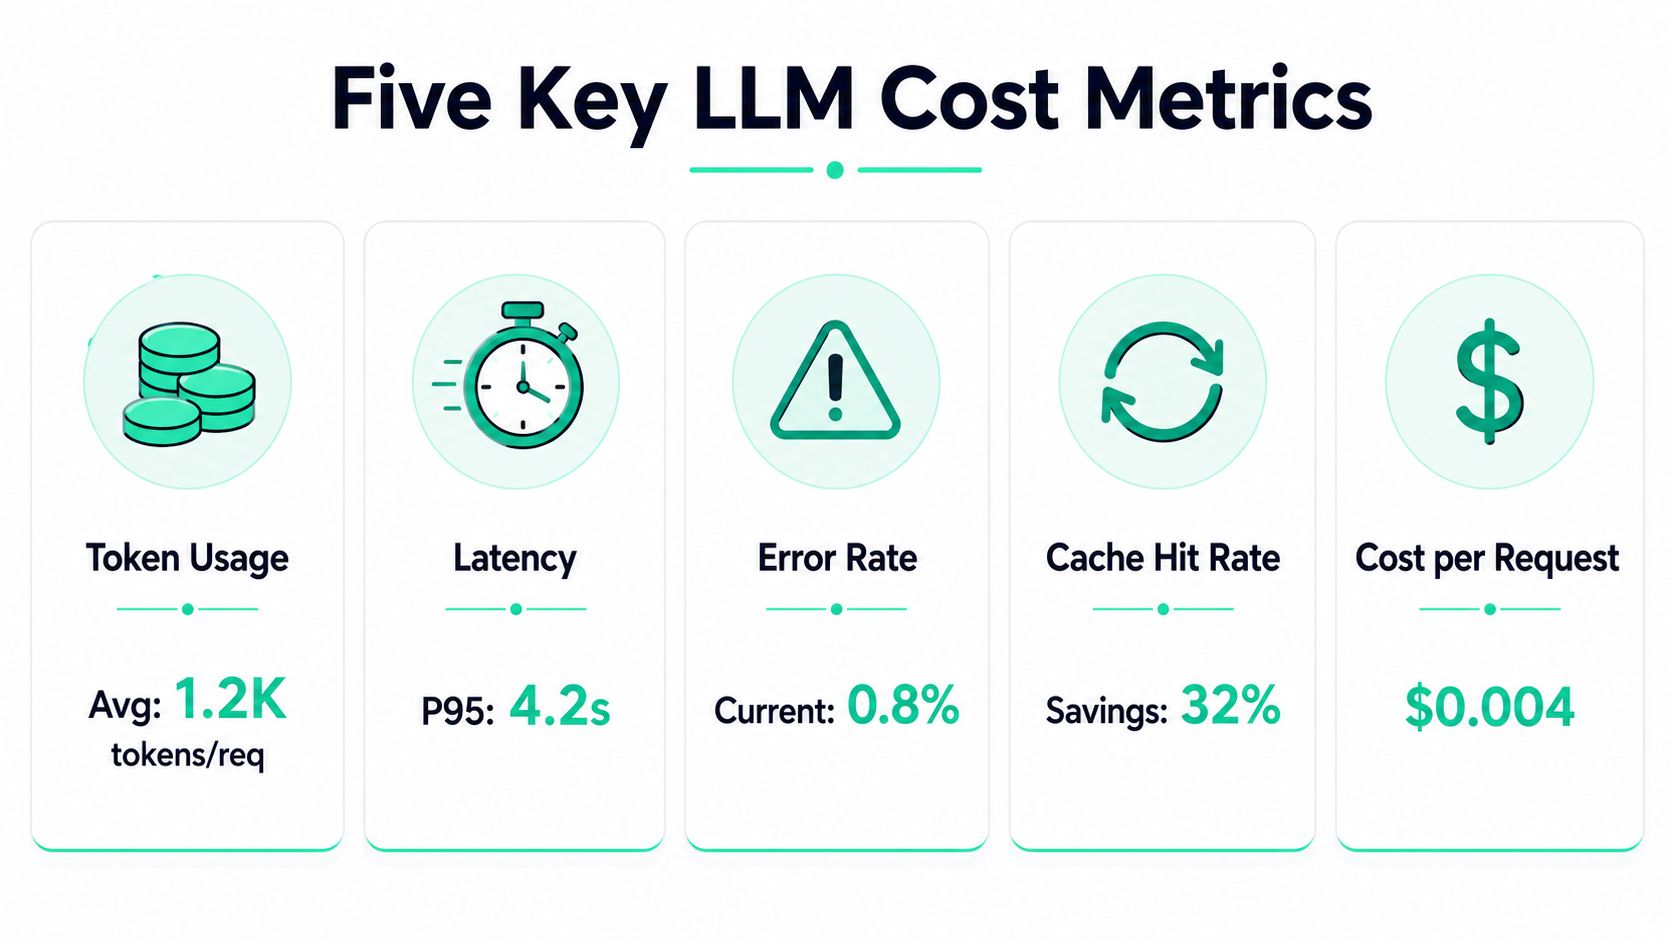
The strongest signals are input tokens, output tokens, cached tokens, latency percentiles, error rate, and cost per call by endpoint. Token usage shows demand, latency tells you whether the user experience is holding up, error rate flags broken paths, and cost per call tells finance what the workflow is costing in practice. Cache signals matter because they reveal whether the same request shape is being reused efficiently or needlessly recomputed.
A practical reading pattern looks like this:
- If input tokens climbed, check for prompt bloat, context duplication, or accidental template growth.
- If output tokens climbed, confirm whether the model is generating more than the product really needs.
- If latency rose with cost, the route may be using a heavier model or longer chain than necessary.
- If error rate rose, the cost spike may be partly hidden by failed retries.
- If cache hit rate fell, inspect prompt changes and routing differences before you blame the model itself.
Endpoint-level comparison matters. Two endpoints can burn the same token volume and still have very different economics if one hits a pricier model or misses cache far more often. That's why the right metric mix matters more than raw volume.
The operational guidance from broader monitoring practice lines up with this. Security and service frameworks both emphasize coverage, latency, and false-alert behavior as core quality markers, while endpoint observability guidance recommends looking at percentiles like P50, P95, and P99 instead of only averages (Palo Alto Networks endpoint effectiveness guidance). For latency-sensitive LLM endpoints, percentile thinking catches the slow tail that users feel.
A useful internal rule is to compare each endpoint against its own baseline, not a generic global threshold. A search workflow and a document-summarization workflow won't have the same natural shape, so forcing them onto one chart only creates false alarms. If you want a deeper critique of why token count alone is misleading, read why token counts miss the real cost story.
Setting Up Alerts That Catch Spend Spikes Early
Spend alerts need to arrive while someone can still do something about them. If the team only sees the problem after the month closes, the alerting setup is decorative, not operational. The best alerts are tied to behavior changes that meaningfully affect budget or user experience, not to arbitrary thresholds someone guessed in a meeting.
A practical setup starts with the rolling average for each endpoint, then compares current behavior against that baseline. Cost-per-call alerts, daily project spend thresholds, and cache-efficiency drops are all useful, but they need to be tuned to the workflow. A high-volume support route should tolerate different variance than a low-volume admin route.
Use escalation paths that match ownership. A product workflow alert should route to the team that owns the feature, while a platform-wide anomaly should also notify whoever can change routing, retries, or model selection. If everyone gets every alert, nobody treats the alert as urgent.
The implementation detail matters. Vendor guidance on endpoint monitoring recommends collecting a baseline first, then tuning thresholds, and testing alerts with simulated incidents or response drills so you know the signal fires when it should (Solutions Insider endpoint monitoring guide). That sequencing keeps you from hard-coding thresholds before you understand normal behavior.
A straightforward alert policy might look like this:
- Cost-per-call anomaly: alert when an endpoint exceeds its own recent average by a meaningful margin.
- Forecast breach: alert when project spend is on track to overshoot budget.
- Cache degradation: alert when cache efficiency falls sharply after a prompt or routing change.
- Error-linked spend: alert when retries or failures start driving extra usage.
- Priority routing: send product-owned spikes to engineering and finance, not to a generic inbox.
The value shows up in saved time as much as saved money. One team that catches an anomaly on the same day can investigate in an afternoon, while a team that finds it at invoice time spends days reconstructing usage history and debating responsibility. The alert itself doesn't save the money, the speed of the response does.
Practical rule: an alert should trigger a decision, not a meeting.
Turning Monitoring Data into Cost Savings
Monitoring only matters when it changes what gets shipped. If the dashboard tells you an endpoint is expensive and nobody changes the endpoint, the dashboard is just expensive wallpaper. Payoff comes when the data points to a lower-cost model, a smaller prompt, or a simpler workflow that produces the same business outcome.
Use endpoint data to rank the next optimization
Start with the highest-spend endpoints, not the noisiest ones. An endpoint that accounts for a lot of monthly spend is a better optimization target than a route that gets discussed a lot in standup but barely moves the bill. Then sort by confidence and implementation risk, because the cheapest option on paper isn't always the safest to ship.
Model-switch analysis becomes practical. If a classification workflow can tolerate a cheaper model, the economics can change quickly, but only if your monitoring shows that the output quality is still acceptable for the task. In other words, the data should support a trial, not dictate a blind replacement.
Prompt waste is often the fastest win. Long templates, repeated instructions, and oversized context blocks push up token usage without adding proportional value, especially when the workflow only needs a narrow slice of the input. Once you see the shape of the request in telemetry, trimming redundant context becomes a product decision, not a guess.
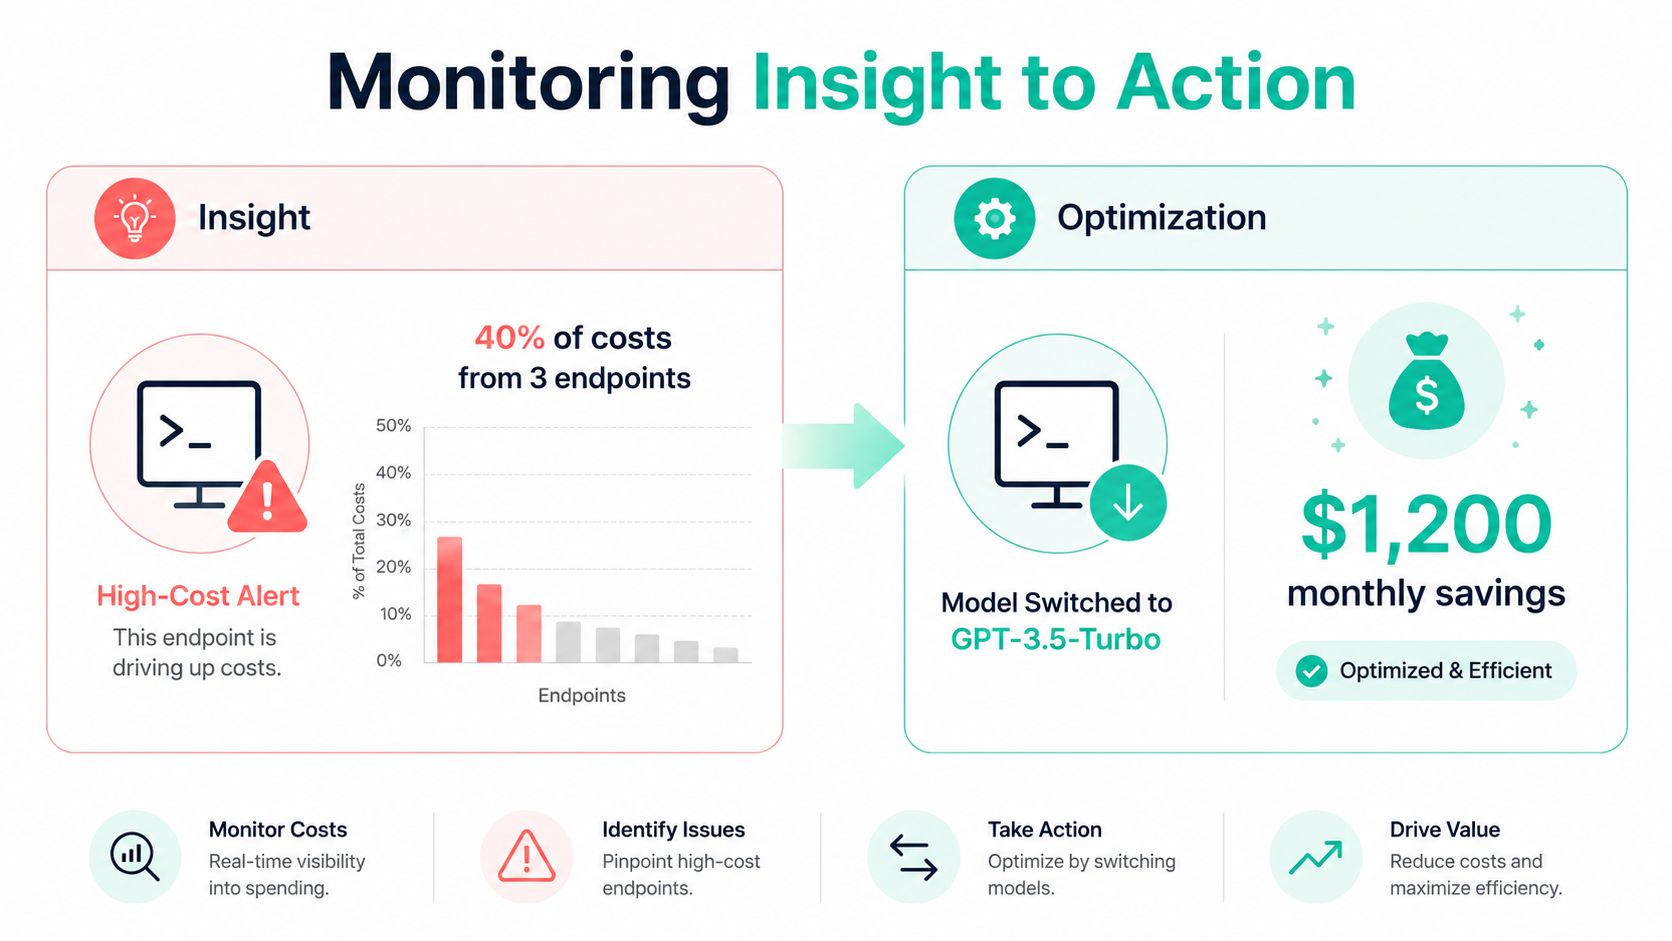
The old trap is chasing every possible optimization. The better move is to focus on the few endpoints that are both expensive and changeable. If one workflow uses too much context, that's a product and prompt issue. If another is over-modelled, that's a routing issue. If a third is retrying too often, that's a reliability issue wearing a cost badge.
For cost allocation patterns that help separate these cases, see cost allocation methods for LLM workloads. The main point is that monitoring data should tell you where the money went, then suggest which lever is most likely to move it without hurting the product.
Privacy-First Monitoring Without Compromising Visibility
The strongest objection to LLM monitoring is privacy, and it's a fair one. Teams don't want to store sensitive prompts or model responses just to understand cost, especially in customer-facing or regulated environments. The good news is that cost attribution doesn't require full content capture.
Metadata-only tracking solves most of the problem. If you record the endpoint identity, timing, model choice, token counts, cache behavior, and request context, you can still see spend patterns clearly without keeping the user's text. Template-only prompt sampling gives you structure without content, which is enough to spot prompt bloat and workflow drift. Hashed API keys help attribution too, because you can group activity without exposing secret material.
Retention policy matters just as much. Shorter retention windows reduce exposure, and they also force teams to decide what deserves to stay in the system. That tends to improve operational discipline, because unnecessary data doesn't hang around just in case someone might need it someday.
The broader endpoint-monitoring world already leans on this operational idea. Continuous telemetry can summarize activity, inventory, and health without turning every event into a content archive, which is why the same mindset works well for AI workflows. If you need a privacy reference point, the project documentation here is the right place to review the defaults and retention model: SpendLens AI privacy documentation.
The trade-off is straightforward. More content gives you more forensic detail, but it also increases risk and review burden. For cost optimization, you usually don't need that content. You need enough structure to answer who used what, when, for which workflow, and at what cost.
If your team is still arguing about which AI feature drove the last invoice spike, instrument the endpoints first and guess less. Start with a naming scheme, wrap the highest-spend calls, and make the metrics useful enough that finance, product, and engineering can all read the same report. If you want a faster path to attribution, spend control, and clearer model-switch decisions, start using SpendLens AI today.