AI Observability Platform: Cut LLM Costs with Real Telemetry
Learn how an AI observability platform tracks token spend, cache hits, and latency to cut LLM costs. Includes instrumentation patterns and adoption playbook.
An OpenAI or Anthropic invoice lands, and it's higher than the forecast. The application is healthy, API errors are low, and infrastructure dashboards look normal. Yet nobody can answer the finance team's basic question: which workload, model, prompt change, or cache miss caused the increase?
That gap is where an AI observability platform earns its place. LLM costs don't follow the same pattern as compute costs. Token volume, input and output pricing, model selection, prompt structure, cache reuse, and tenant behavior all shape the bill. If your telemetry only shows request counts and latency, you can confirm that calls happened, but you can't make a confident cost decision.
The practical standard is higher now. Teams need visibility that connects token spend, cache efficiency, workload attribution, quality, and application behavior, while avoiding unnecessary collection of sensitive prompts and responses.
Table of Contents
- Why Your AI Bill Keeps Surprising You
- Core Telemetry Signals That Actually Matter
- Instrumentation Patterns and Trade-offs
- Turning Observability Data into Cost Savings
- Privacy, Attribution, and Multi-Provider Complexity
- Your 90-Day AI Observability Adoption Playbook
- Making the Business Case for AI Observability
Why Your AI Bill Keeps Surprising You
A monthly AI bill can rise without a conventional outage. A product team may add conversation history to a prompt, a support workflow may start producing longer answers, or a deployment may route more requests to a premium model. The service still returns successful responses, so standard APM reports a healthy system while finance sees an unexplained variance.
Traditional dashboards answer useful infrastructure questions. They show request volume, error rates, CPU, memory, and latency. They usually don't answer whether a longer context window caused the spend, whether output verbosity increased, whether a cache opportunity was missed, or whether one customer's workflow is consuming a disproportionate share of the budget.
Practical rule: If a dashboard can't connect a provider charge to a workflow, model, feature, or tenant, it's a health dashboard, not a cost-control system.
Consider a retrieval-augmented support assistant. A trace might show that the request called an embedding service, retrieved documents, and invoked an LLM. That trace is useful for debugging, but it still leaves several finance questions open. Did the retrieval step return too much context? Did the request use cached input? Was the answer unnecessarily long? Would a less expensive model meet the quality requirement for this specific task?
Teams often compensate by exporting provider invoices into spreadsheets. That approach creates a lag between the behavior that caused the charge and the review that discovers it. It also loses operational context. A provider dashboard may identify a model and account, but your engineering team needs the release, endpoint, feature flag, or customer segment that made the usage change.
The category has expanded because production GenAI systems need specialized visibility into more than infrastructure and application telemetry. Gartner has said the broader observability industry could reach about USD 14.2 billion by 2028, while dedicated AI observability forecasts now place the segment in the low single-digit billions and project rapid expansion. One forecast estimates a 25.47% CAGR through 2030, and another values the market at USD 2.71 billion in 2025, with a projection of USD 20.52 billion by 2035 at a 22.47% CAGR. These are projections from different market studies, not a single agreed market size, but they reflect the same operational shift described by Network World's analysis of AI workloads and observability.
The issue isn't that AI is impossible to budget. It's that usage is invisible at the level where decisions happen. A practical overview of this problem is available in why invisible AI usage creates cost surprises. Once teams can associate spend with behavior, optimization stops being a post-invoice investigation and becomes part of normal platform operations.
Core Telemetry Signals That Actually Matter
An LLM cost dashboard should begin with decision-grade signals, not a long list of generic metrics. The most useful fields explain what happened, who initiated it, what it cost, and which change could reduce that cost without damaging the user experience.
Start with token accounting. Record input tokens, output tokens, cached input where the provider exposes it, model, provider, workload, and request outcome. Input and output pricing must remain separate because they often have different rates. One study summarizing 116 analyses reports GPT-4o output pricing at $15.00 per million tokens compared with $5.00 per million input tokens, a 3x premium documented in the prompt engineering evidence review. That makes excessive output a direct optimization target, not merely a style concern.
Cache telemetry adds the next layer. A cache hit rate tells you whether repeated system instructions, templates, or stable context are being reused. A high miss rate on a workload with a large repeated prefix means the service may be paying full input price for content that could have been cached. The metric becomes actionable only when it's joined to token volume, model pricing, and the specific prompt pattern.
Latency still matters, but averages hide important behavior. Per-call distributions, timeout rates, model routing, and workload-level latency help teams distinguish a cost-saving model switch from a performance regression. A cheaper model that causes retries or creates longer downstream workflows may not be cheaper in practice.
Prompt waste signals are also valuable. Flag large templates, repeated instructions, oversized retrieved context, and long outputs. Don't store raw prompts to find these patterns if metadata or template fingerprints can answer the question. A template hash, token count, route, release identifier, and workload tag can reveal that a deployment increased context size without retaining customer content.
| Telemetry Signal | What It Reveals | Cost Impact Example |
|---|---|---|
| Input and output tokens | Separates context cost from generation cost | A verbose response becomes a priority when output tokens carry a higher rate than input tokens |
| Cache reads and cache misses | Shows whether repeated context is being reused | A repeated support template with frequent misses signals a caching opportunity |
| Model and provider | Identifies pricing and capability differences | A classification route may be suitable for testing against a lower-cost model |
| Workload, feature, or tenant tags | Assigns responsibility for spend | Finance can review usage by product feature rather than by shared API account |
| Latency distribution and retries | Connects performance behavior to token usage | A slow route may generate retries that increase total spend |
| Prompt size and template fingerprint | Detects context bloat without retaining content | A release can be compared against the prior template version using token counts |
Instrument the path that makes the decision, not every possible field. The endpoint monitoring guidance is useful for connecting request-level behavior to the application route that owns the cost.
Instrumentation Patterns and Trade-offs
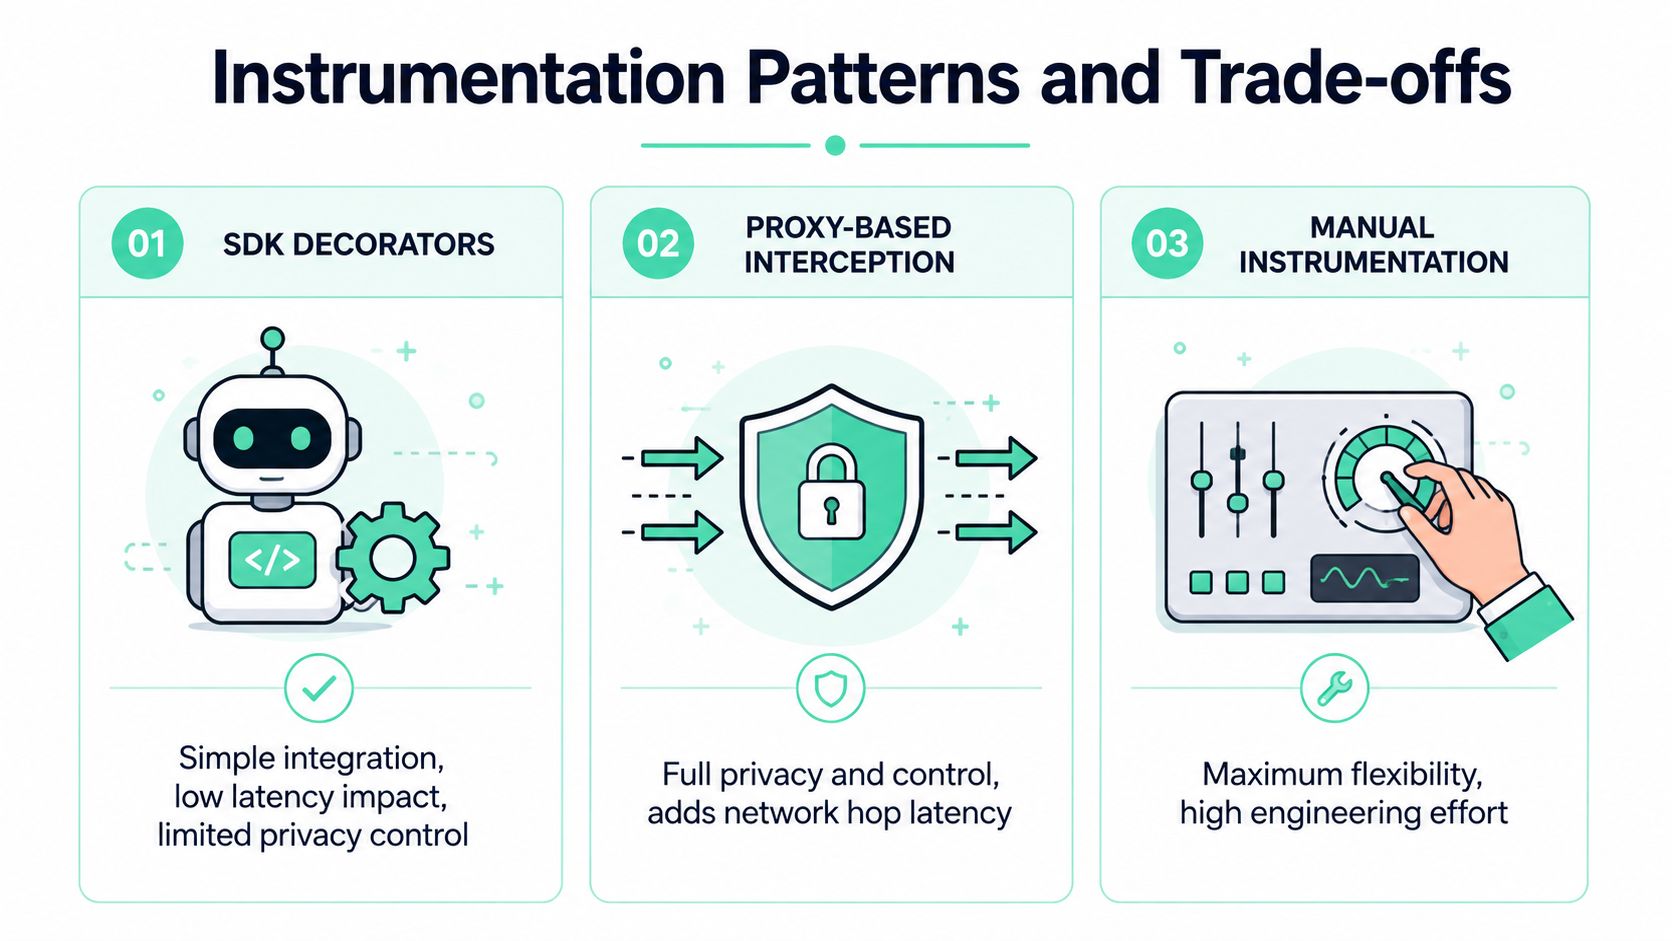
There are three practical ways to add telemetry to LLM services: SDK decorators, proxy interception, and manual instrumentation. None is universally best. The right choice depends on latency tolerance, privacy requirements, provider diversity, and how much maintenance your team can absorb.
SDK decorators
A decorator wraps the existing provider call in application code and records metadata around it. This pattern usually preserves the existing OpenAI or Anthropic client configuration, retries, and network path. It's a strong fit when a Python team wants to instrument several services without replacing provider clients or introducing a central gateway.
The trade-off is control. A decorator may not see every request if a service uses multiple calling patterns, and privacy behavior depends on the SDK's defaults and configuration. Teams should verify whether prompts and responses are retained, whether sampling is configurable, and whether tags can be applied consistently.
Proxy-based interception
A proxy provides centralized routing, policy enforcement, logging, and provider normalization. It can be attractive for organizations that need one control point across languages and services. It also introduces a network hop, a new availability dependency, and routing risk. A proxy outage or misconfiguration can affect every LLM call that depends on it.
Privacy control can be stronger because the proxy owns the collection boundary, but that doesn't automatically make it safer. The proxy still receives the request payload, so retention, redaction, access control, and tenant isolation require careful design.
Manual instrumentation
Manual instrumentation offers maximum flexibility. Engineers can emit exactly the fields they need, attach domain-specific identifiers, and avoid collecting content by design. The downside is uneven coverage. One service may record cached tokens while another records only total tokens, making cross-workload comparison unreliable.
Deployment lesson: Start with the least invasive pattern that produces consistent token, cost, model, and attribution fields. Add deeper hooks only when a concrete decision requires them.
A privacy-aware implementation should default to metadata-only tracking, prompt-template sampling rather than full content capture, and hashed API keys. Teams can still attribute spend to workflows, features, experiments, endpoints, or tenants without storing the sensitive text that passed through the model.
OpenTelemetry can provide a useful transport and schema foundation, but the implementation still needs clear conventions for cost and privacy fields. The OpenTelemetry documentation for LLM instrumentation is a practical starting point for teams standardizing telemetry across services.
Turning Observability Data into Cost Savings
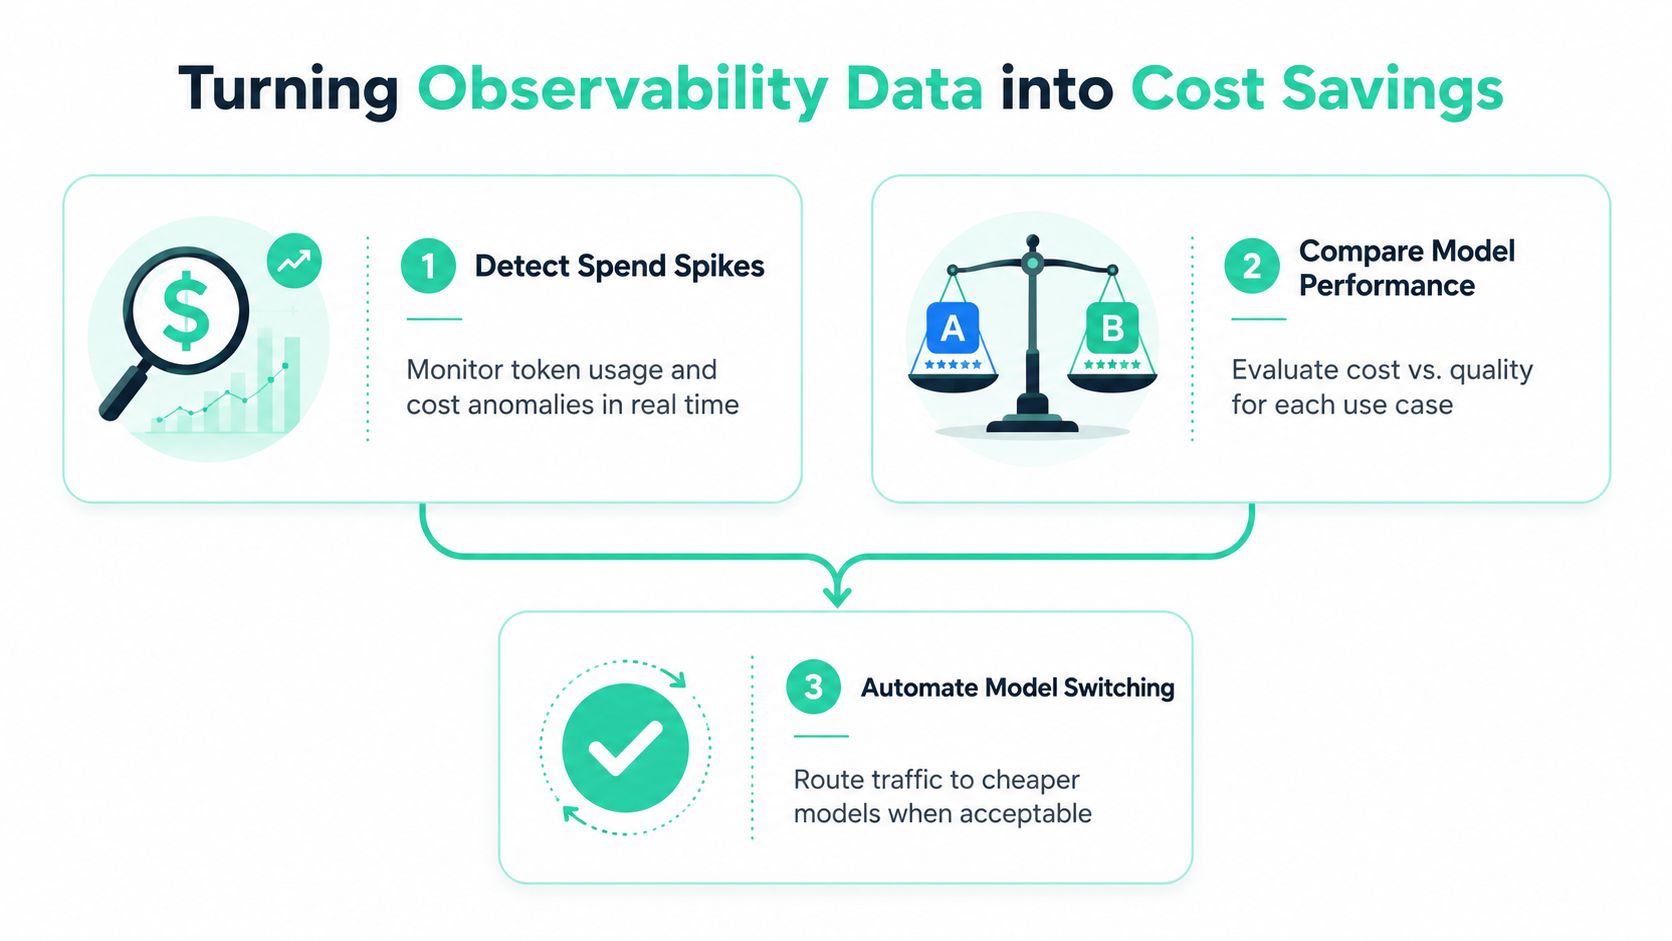
Telemetry only matters when it changes an engineering or product decision. The most effective teams treat an AI observability platform as an optimization queue, not a collection of attractive dashboards.
Detect the driver before changing the system
When spend rises, begin with a comparison against the last known-good release. Break the variance down by provider, model, workload, input tokens, output tokens, cache reads, cache misses, retries, and traffic tags. A prompt change that increases input tokens needs a different fix from a routing change that sends the same workload to a more expensive model.
Caching is a concrete example. OpenAI bills cached input at 10% of normal input price when the prompt is at least 1,024 tokens, and Anthropic cache reads are also billed at 10% of base input price, according to the documented prompt caching examples. Those rates create a clear experiment: identify repeated prefixes, measure cache reads and misses, then compare spend before and after enabling reuse.
Anthropic's cache economics require slightly more care. A 5-minute cache write costs 1.25x standard input pricing, a 1-hour write costs 2.0x, and cache reads cost 0.10x, as described in this guide to Anthropic prompt caching mechanics. The first request carries a write premium, so the workload needs enough repeated reuse to repay it.
Compare models by workload
Don't compare models across an entire application. Compare them within a defined workload, such as ticket classification, document extraction, or response drafting. Hold the prompt structure and evaluation set steady, then review cost, latency, error behavior, and quality together.
A useful recommendation should include estimated savings, confidence, and migration risk. High-confidence, low-risk opportunities should be tested first. A smaller model may be a sensible candidate for deterministic classification, while a complex reasoning workflow may require a more capable model even if its unit price is higher.
Forecast and operationalize
Forecasting improves when spend is grouped by workload and tied to usage drivers. Track whether growth comes from more users, longer conversations, larger context, repeated retries, or a new feature. That explanation is more useful than extrapolating the total invoice as a single line.
One public example shows a 10M-token-per-day cached-prefix workload falling from $90 per month to $25.50 per month on Anthropic and from $1,500 per month to $390 per month on OpenAI, representing savings of 72% to 74% depending on the pricing model, as reported in the caching examples above. Treat such examples as workload-specific illustrations, not guaranteed outcomes.
Operating principle: A recommendation without a controlled comparison is a hypothesis. Route a limited workload, inspect quality and retries, then expand only when the evidence supports it.
For leadership, turn the result into a recurring report that names yesterday's spend, the largest driver, the change responsible, and the next action. Practical reporting patterns are covered in best practices for AI cost reporting.
Privacy, Attribution, and Multi-Provider Complexity
The hardest observability question is often not “can we trace the request?” It's “can we explain the cost without collecting information we shouldn't retain?” Production prompts may contain customer data, internal documents, account details, or proprietary instructions. Storing every prompt and response creates a larger security and compliance surface than many teams need.
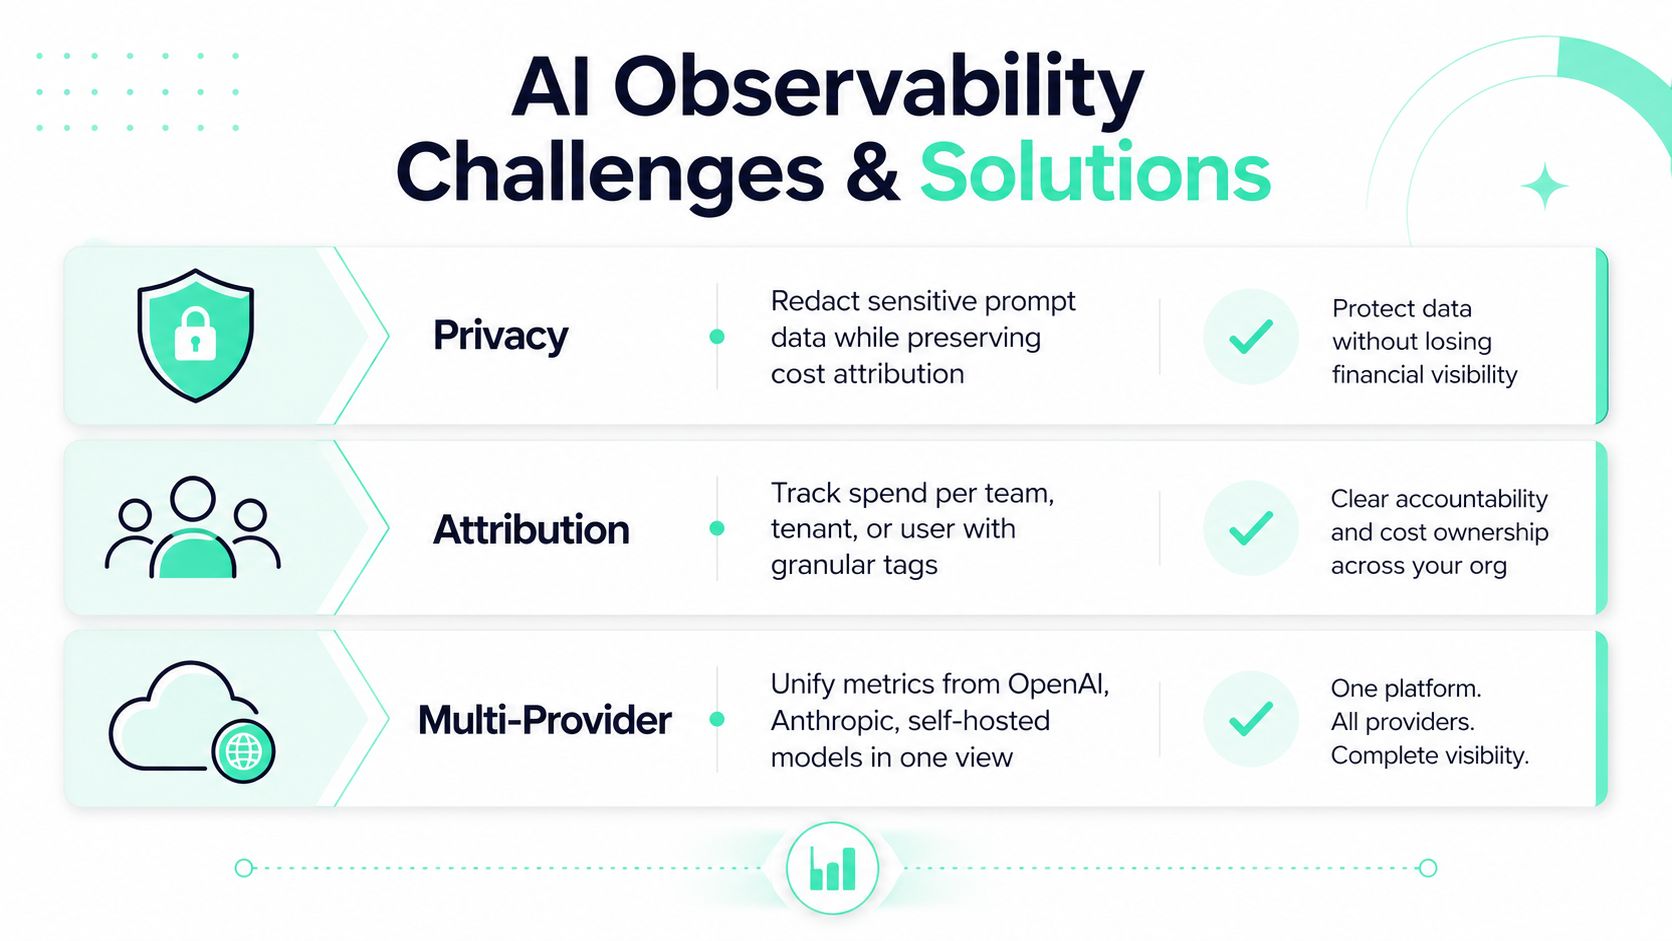
Metadata-only collection is often enough for cost control. Record model, provider, token counts, cache signals, route, release, tenant identifier, and workload tags. Use hashes or stable fingerprints for prompt templates, and keep content capture disabled unless a specific debugging workflow requires tightly controlled sampling.
Attribution needs a clear ownership model. A shared API account can hide whether spend belongs to search, support, onboarding, or an internal experiment. Tags should be applied at the boundary where the business meaning is known, such as the feature handler or workflow orchestrator. Tenant attribution should use stable identifiers with access controls, while executive reports can aggregate those identifiers into product or department views.
Cross-provider reporting adds another complication. OpenAI and Anthropic expose different pricing structures and cache mechanics, while self-hosted models have infrastructure costs rather than provider invoices. A unified platform should normalize tokens, calls, latency, cache behavior, and estimated cost without pretending that all cost models are identical.
The OpenTelemetry GenAI specification doesn't cover cost calculation, prompt privacy handling, or multi-tenancy attribution. Teams still need to calculate spend from token counts and define their own data policies, a gap discussed in the 2026 LLM observability landscape commentary.
Procurement questions that matter
- Retention: Can you disable prompt and response storage, set retention by data type, and delete records reliably?
- Attribution: Can you report by team, tenant, feature, workflow, endpoint, release, and model?
- Provider coverage: Can the system normalize OpenAI, Anthropic, self-hosted models, and future providers without losing pricing detail?
- Access control: Can finance see aggregated cost while engineering retains operational detail?
- Reporting: Can the platform produce daily summaries, budget views, and exportable data without manual spreadsheet work?
If a vendor answers only with trace screenshots, keep asking about privacy boundaries and financial ownership. A trace can explain a request path, but an operating model needs to explain who pays, why the cost changed, and what action is safe.
Your 90-Day AI Observability Adoption Playbook
A successful rollout starts with one expensive or strategically important service. Broad instrumentation sounds efficient, but it often produces inconsistent tags and a large volume of telemetry before the organization agrees on what the data means.
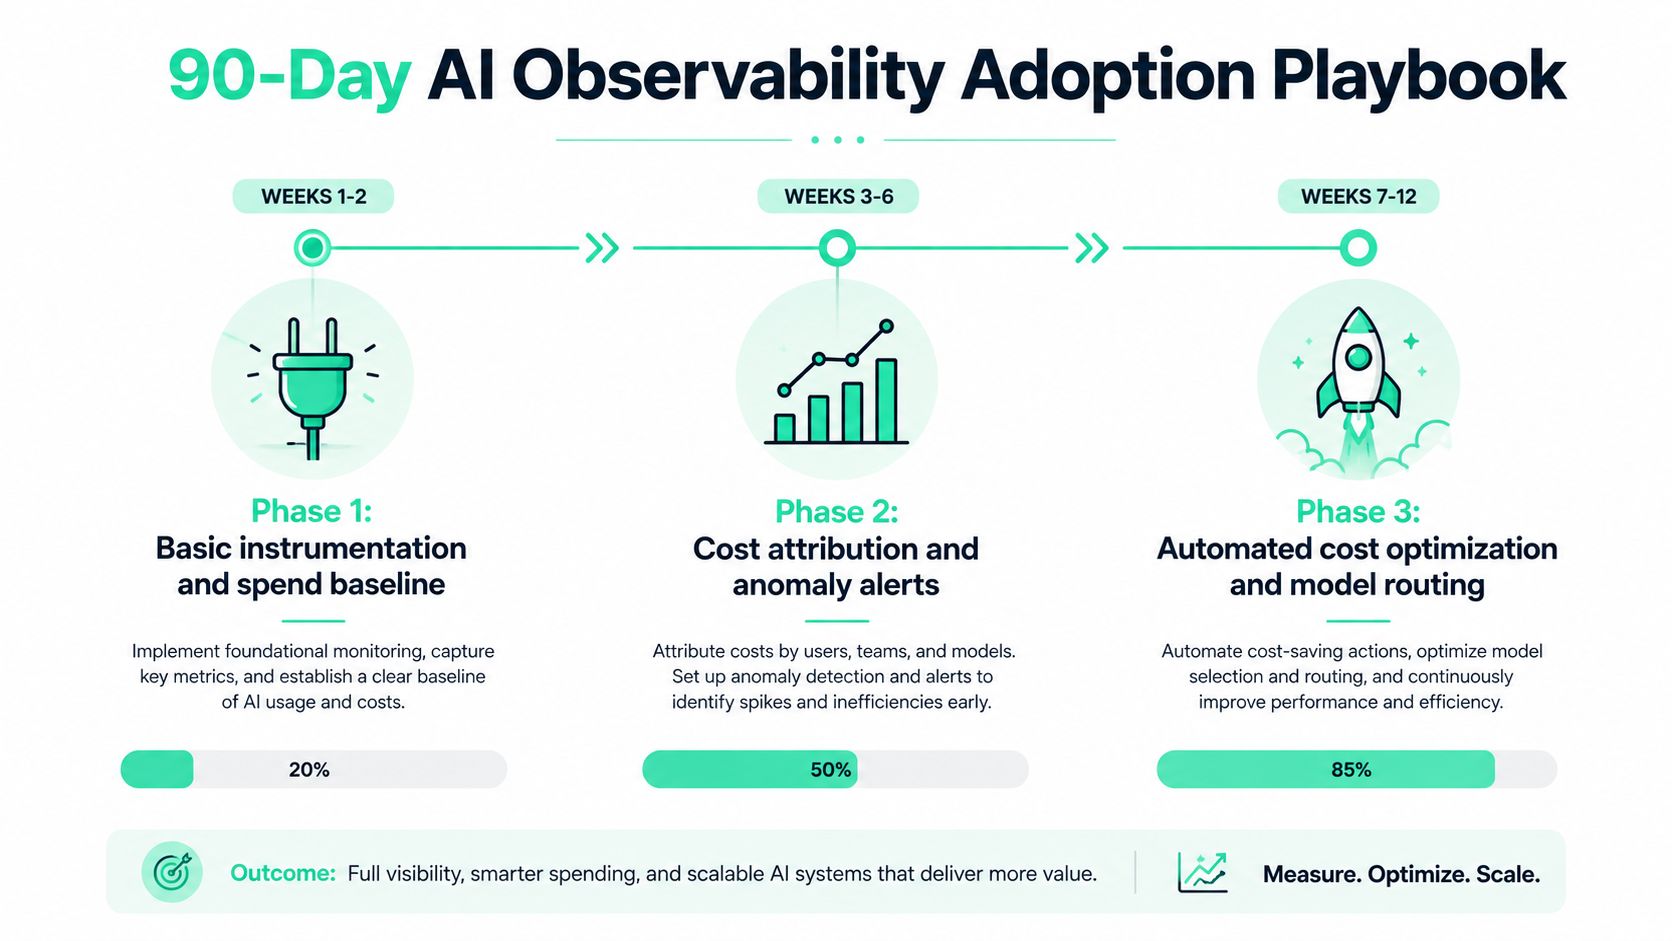
Weeks 1 to 2, establish the baseline
Instrument one service and capture model, provider, input tokens, output tokens, cache signals where available, latency, errors, retries, route, and release. Define a small tag vocabulary before adding dashboards. A useful first milestone is a daily view that reconciles application telemetry with provider usage closely enough to explain the major cost categories.
Avoid collecting full prompts by default. Validate that the instrumentation doesn't alter client retries, timeout behavior, or request routing. Have engineering and finance review the first report together, because a technically accurate dashboard can still fail if nobody agrees on the ownership dimensions.
Weeks 3 to 6, add attribution and anomaly handling
Add tags for feature, workflow, team, and tenant where those values are available. Classify similar operations so model comparisons use comparable workloads rather than blended application averages. Track cache opportunities and alert on meaningful deviations in tokens, model mix, or cost per successful operation.
The milestone here is an investigation that starts with a spend change and reaches a responsible workload without manual log searching. Common pitfalls include inconsistent tag names, missing release identifiers, and alerts that fire on normal usage growth instead of a real behavioral change.
Weeks 7 to 12, introduce recommendations
Use the baseline to rank model alternatives, prompt reductions, caching changes, and routing adjustments by impact, confidence, and migration risk. Run controlled tests on one workload at a time. Quality checks should match the task. Classification needs classification accuracy or business outcome checks, while drafting workflows may require review sampling and acceptance measures.
By the end of this phase, leadership should receive a recurring report that connects usage growth to product activity and identifies the next optimization experiment. Escalate to formal FinOps when multiple teams share budgets, product pricing depends on AI margins, or model usage becomes a material operating expense.
The roadmap works because it creates an early win before introducing automation. Engineers first learn where the money goes, then decide which actions are safe to automate.
Making the Business Case for AI Observability
The business case is strongest when observability connects three outcomes: money saved, engineering time recovered, and risk reduced. A team that can identify a prompt regression shortly after deployment avoids a prolonged invoice investigation. A team that can compare models by workload can test lower-cost routes without guessing. Finance gains a defensible explanation for forecast changes instead of receiving a blended provider total.
Caching illustrates the potential clearly. The public examples above show monthly reductions from $1,500 to $390 and from $90 to $25.50 for specific cached-prefix workloads, with savings of 72% to 74% under those pricing assumptions. The result depends on repeated context, token volume, provider pricing, and implementation details, so the value of observability is knowing whether your workload has the same conditions.
The market is formalizing around this need. Forecasts place the dedicated AI observability category at USD 1.42 billion in 2025, projected to reach USD 3.21 billion by 2034 at a 9.4% CAGR, while another estimate projects growth from USD 1.240 billion in 2025 to USD 12.750 billion by 2032 at a 40% CAGR. A separate forecast estimates USD 2.3 billion in 2025 and USD 13.8 billion by 2034, with model monitoring representing 32.5% of segment share and Asia Pacific representing 38.2% of revenue share. These differing estimates, summarized by Intel Market Research's AI observability market overview, show an expanding category rather than a single settled market measurement.
Treat the platform as cost-control infrastructure, not another debugging dashboard. Start with one high-spend service, measure the baseline, and make the first recommendation specific enough to test.
SpendLens AI provides lightweight, developer-first telemetry for OpenAI and Anthropic workloads, with spend attribution, cache efficiency, prompt waste signals, and model-switch recommendations without proxying requests or storing prompts and responses by default. Visit SpendLens AI to instrument a service, identify the largest cost driver, and turn your next optimization review into an evidence-based action plan.