9 Best Practices for Reporting LLM Spend in 2026
Explore 9 best practices for reporting LLM spend, with tagging, dashboards, privacy defaults, savings examples, alerts, and SpendLens AI recipes.
A provider invoice isn't a reporting system. Knowing that OpenAI or Anthropic charged your account tells you the total, but not which project, feature, customer, model, prompt pattern, or deployment caused it. It also doesn't tell you whether the spend produced useful work, whether caching performed well, or which team should act next.
The best practices for reporting LLM spend connect cost with ownership, quality, cache efficiency, business value, and a specific operational decision. A useful report might reveal that a feature is unprofitable, recommend a lower-cost model for a defined workload, expose redundant context in a prompt, or show that an optimization preserved quality while reducing waste.
Dashboards help, but they aren't the operating system. Reporting must move from instrumentation to attribution, comparison, optimization, governance, and executive action. The nine practices below create that progression, with implementation patterns that can be applied through SpendLens AI without replacing standard provider clients.
Table of Contents
- 1. Implement Granular Cost Attribution Through Decorator-Based Tagging
- 2. Establish Daily Executive Spend Summaries With Trend Detection
- 3. Conduct Cross-Model Comparison Testing With Confidence-Weighted Recommendations
- 4. Identify and Eliminate Prompt Waste Via Template Analysis and Context Audits
- 5. Deploy Prompt Caching Strategies for High-Volume Repetitive Context
- 6. Establish Cost Ownership and Budgeting Frameworks by Project and Feature
- 7. Implement Tiered Model Selection Based on Task Complexity and Quality Requirements
- 8. Tiered Model Routing and Fallbacks
- 9. Tiered Model Selection, Monitoring, A/B Testing, and Metrics
- 9-Point Comparison: Reporting Best Practices
- Turn Reporting Into a Weekly Savings Loop
1. Implement Granular Cost Attribution Through Decorator-Based Tagging
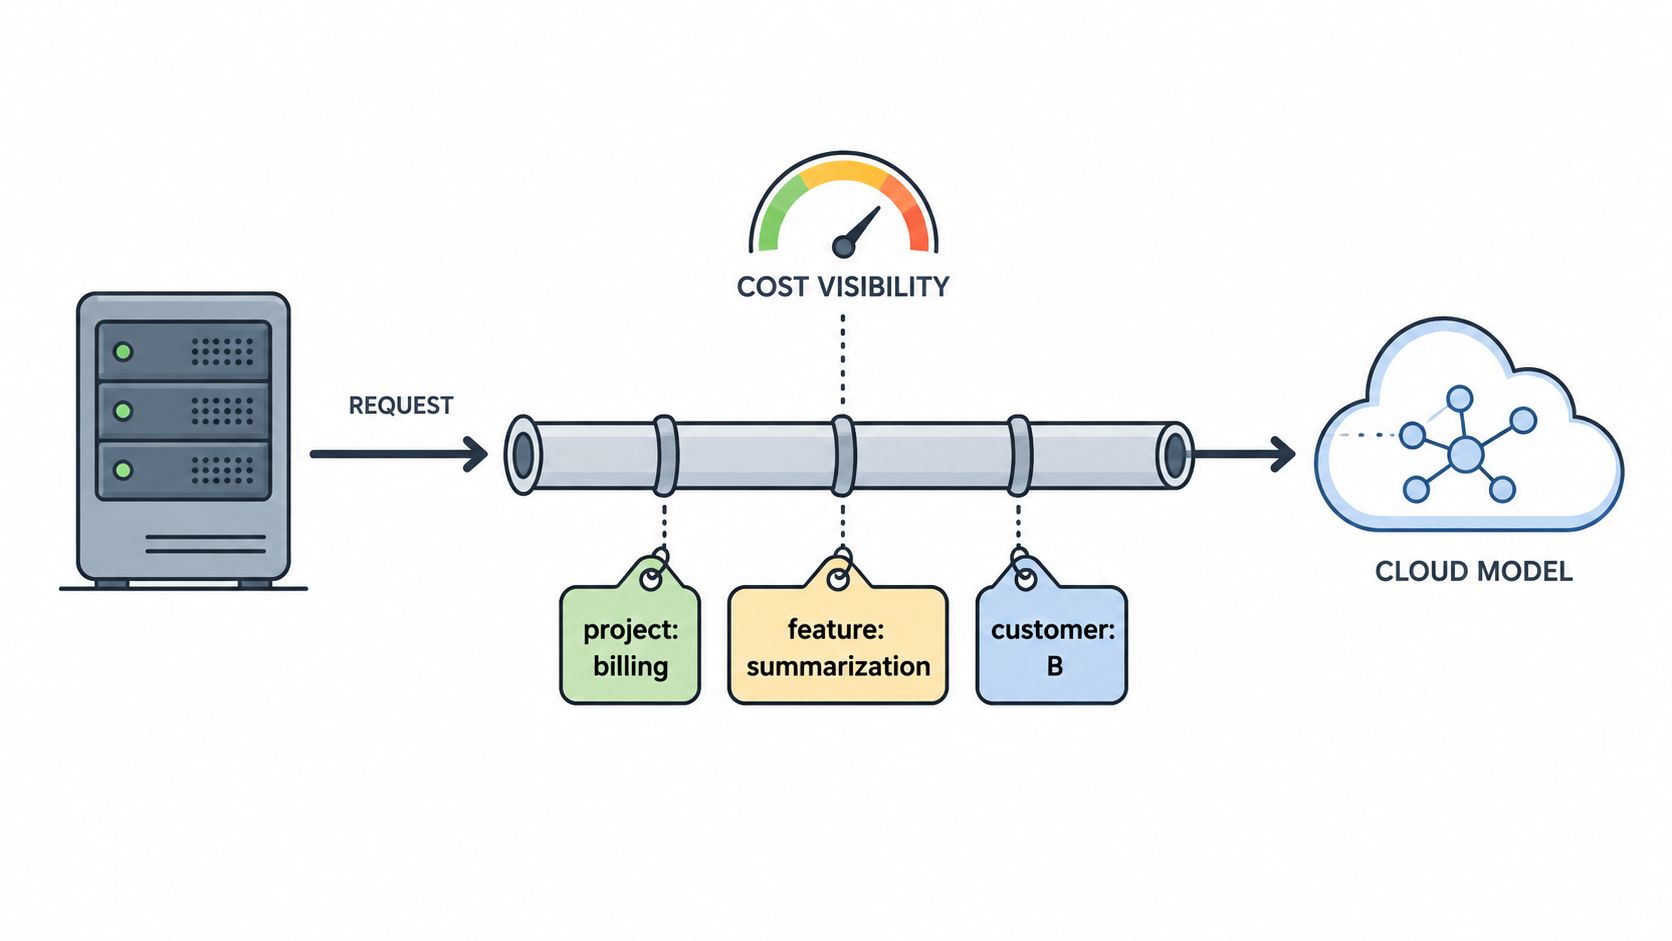
Cost attribution starts at the LLM call, not at the end of the billing cycle. Lightweight decorators and metadata tags can associate each request with a project, feature, workflow, customer, endpoint, or environment while leaving the underlying OpenAI or Anthropic client configuration intact. That approach avoids a proxy in the request path and limits the refactoring required to instrument existing services.
A SaaS platform might begin with customer_id, feature_name, and environment. A call tagged as summarization, content_generation, prod, or `staging gives finance and engineering a shared language for investigating spend. Start with three to five high-level tags, then add customer or endpoint detail only when the decision requires it.
Practical rule: A tag is valuable when it answers a business question, such as “Is this feature profitable?” or “Which customer cohorts justify higher model costs?”
Create a taxonomy in the engineering runbook. Define allowed values, ownership, and whether a tag is mandatory. Review tag cardinality regularly so teams don't create thousands of low-volume categories that make reports harder to interpret. Pair important tags with alerts that notify owners when daily spend crosses an agreed threshold.
For implementation patterns covering allocation across projects and services, see cost allocation methods for LLM workloads. SpendLens AI can apply @spendlensai.observe, track(), and client.tag() around existing calls, giving teams per-call metadata without introducing proxy latency.
2. Establish Daily Executive Spend Summaries With Trend Detection
Executives rarely need another unrestricted dashboard. They need a concise explanation of what changed, why it changed, and what decision has the highest financial impact. A daily summary should show yesterday's spend, the leading cost driver, the relevant trend, and the strongest savings recommendation.
Recipients should receive different levels of detail. A CFO needs total spend, direction, forecast, and financial exposure. A VP of Engineering needs the top drivers and technical action. Product managers need feature-level cost and value. Each report should include a dashboard link so interested readers can investigate without asking an engineer to assemble context.
An anomaly threshold should reflect the platform's normal variability. A fast-growing startup may tolerate larger swings than a stable SaaS product, but either team needs a documented rule and an owner for investigation. Critical alerts can also reach Slack, while the full summary arrives early enough for leadership to act during the workday.
The operational value comes from ranking recommendations by estimated monthly savings, confidence, and migration risk, rather than listing every possible optimization. A report that says “spend increased” creates work. A report that identifies the workload, likely cause, owner, and next experiment supports action.
Use AWS cost anomaly detection guidance as a reference point for designing anomaly workflows, even when the underlying LLM spend spans multiple providers. SpendLens AI's executive summary pattern focuses on yesterday's spend, the top cost driver, and the highest-impact recommendation.
3. Conduct Cross-Model Comparison Testing With Confidence-Weighted Recommendations
The cheapest model isn't automatically the right model. The correct comparison is cost per successful business outcome, measured against quality, latency, reliability, and migration effort for a specific workload.
Start with the largest cost drivers, then test model families such as OpenAI, Anthropic, Gemini, Qwen, Mistral, DeepSeek, and Llama. A reusable A/B harness should send comparable requests to the candidate models, preserve representative inputs, and evaluate outputs against a reference set or human review process. For real-time features, include p99 latency because a lower token bill can still damage the user experience.
A recommendation should communicate uncertainty. “Switch models” is incomplete. “Test this candidate for this workload, with estimated savings, confidence, quality guardrails, and migration risk” gives leadership enough context to approve a controlled experiment.
Rank tests by expected value
Prioritize opportunities using a simple decision order:
- Estimated impact: Start with workloads where a successful change could materially reduce monthly spend.
- Confidence: Separate well-supported substitutions from ideas that require deeper validation.
- Migration risk: Flag changes that affect infrastructure, latency, output structure, or provider dependencies.
- Task fit: Record request length, output format, reasoning depth, and domain so future comparisons become more predictive.
A customer support system may discover that short ticket summaries can use a lower-cost model while complex technical questions still require a stronger one. A research platform might reject an apparently cheaper open model because added latency or hosting work outweighs the savings. Reporting the decision not to optimize is useful too, because it records why the team preserved the current configuration.
SpendLens AI's LLM pricing comparison workflow can help organize provider and model alternatives around workload-level recommendations instead of raw price lists.
4. Identify and Eliminate Prompt Waste Via Template Analysis and Context Audits
Prompt waste often hides inside successful applications. Oversized system instructions, repeated rules, unnecessary conversation history, excessive few-shot examples, and verbose outputs can all increase token consumption without improving the result. The reporting task is to identify structural waste while protecting user privacy and output quality.
A metadata-only approach is safer for routine analysis. Store the template structure, token distribution, model, workload, and version, rather than user prompts or model responses by default. Then sample the highest-cost workload and compare the current template with a slimmer version against reference outputs.
A practical audit should answer four questions:
- What is repeated: Find instructions, examples, headers, or context that appear on every call.
- What is consumed: Compare the context supplied with the context needed for the task.
- What is displayed: Remove reasoning or formatting that users never see.
- What is worth fixing: Rank opportunities by token savings, call frequency, and model cost.
For example, a support workflow may not need the entire conversation history on every request. A concise summary and a limited recent context can reduce waste, but only if evaluation confirms that answer quality remains acceptable. Version optimized templates so teams can identify which change produced a cost or quality movement.
Schedule periodic audits because prompts evolve. New instructions, examples, and product requirements can gradually turn a focused template into an expensive one. SpendLens AI's few-shot prompting guidance is relevant when teams are deciding how much example context a workload needs.
5. Deploy Prompt Caching Strategies for High-Volume Repetitive Context
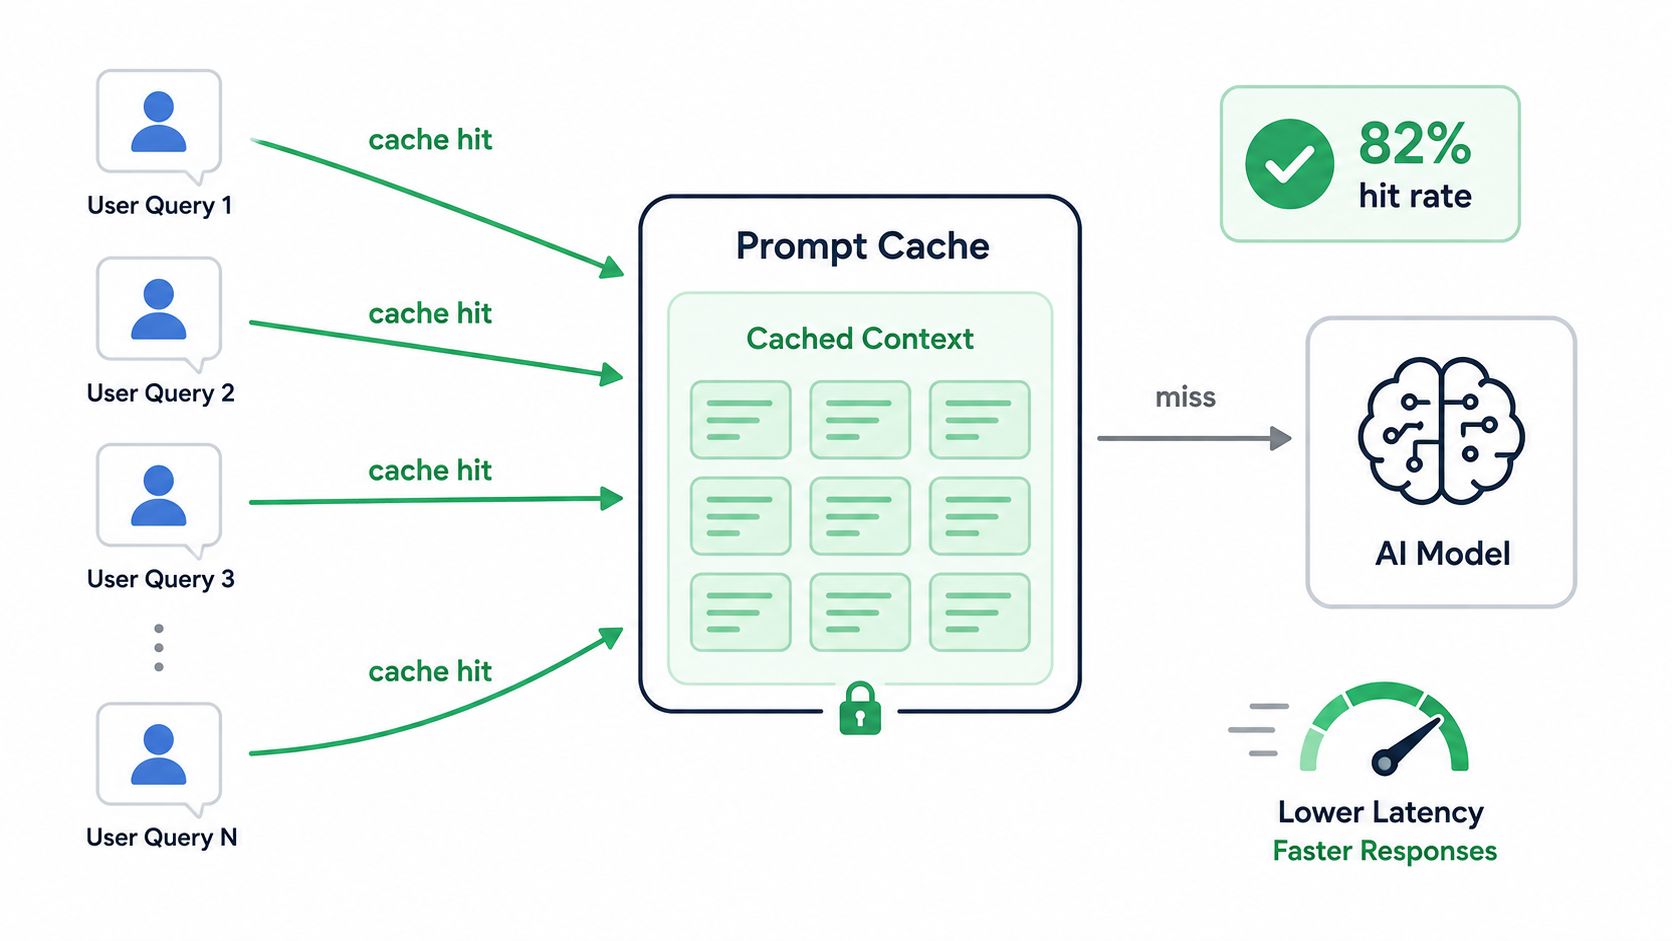
Caching is a reporting problem before it's an implementation problem. Teams need to know which context is large, stable, and reused often enough to justify cache design. Sort workloads by context size multiplied by monthly call frequency, then separate static material from dynamic user content.
A legal research tool may cache a stable corpus while passing the current question separately. A code analysis service can cache a versioned codebase and invalidate it when the repository changes. A support assistant can cache conversation context selectively, provided the invalidation rules prevent stale information from influencing replies.
Track more than the cache hit rate. A useful report includes:
- Cached-token share: How much input was served from cache.
- Cache hit rate: How often requests found usable cached context.
- Cost per call: Whether caching changed unit economics.
- Latency: Whether cache hits improved response speed.
- Invalidation events: Whether updates cause stale or repeated context.
A high hit rate can still conceal poor economics if the cached block is small or the workload runs infrequently. Conversely, a moderate hit rate may be valuable for a large, repeatedly reused context. Report the baseline and the post-change result, then show the value as money saved, time saved, avoided recomputation, or latency changed.
For multi-turn conversations, teams can test periodic cache refreshes rather than caching every turn. The correct cadence depends on context volatility and provider behavior, so the report should make that trade-off visible.
6. Establish Cost Ownership and Budgeting Frameworks by Project and Feature
A budget without ownership is a forecast, not a control. Assign each project, feature, or shared service an accountable owner, a spending envelope, and a defined unit of usage. Then report actual spend against budget alongside product usage and business value.
Build budgets from bottom-up estimates supplied by feature owners. A search team should explain expected request volume and model choices. A chat team should document context and session behavior. Finance and leadership can challenge assumptions, but engineering must own the operational drivers.
Use thresholds that create time to respond. A dashboard can show current pace against budget, forecasted end-of-period spend, and the action most likely to correct an overrun. If a routine generation workflow is approaching its limit, the owner might switch only that workload to a cheaper model rather than imposing a broad freeze.
Shared services require careful allocation. Chargeback by unit, such as cost per embedding request or cost per classified item, is often more defensible than distributing infrastructure costs arbitrarily. The report should state the allocation rule so teams understand what they can influence.
A budget conversation is stronger when it includes value: show spend beside revenue contribution, avoided manual work, quality preserved, or another outcome the owner can improve.
Keep cost accountability separate from performance reviews at first. The initial purpose is awareness and correction, not punishment. Once tagging, forecasting, and unit economics become reliable, leadership can use the reporting system for pricing, feature prioritization, and capacity planning.
7. Implement Tiered Model Selection Based on Task Complexity and Quality Requirements
Model choice should follow the task's quality requirement, not a blanket preference for capability or low price. Classification, extraction, routing, and formatting may fit a compact model, while difficult reasoning, domain analysis, and technical support may require a stronger one. Set the selection policy before deployment, then record which workloads qualify for each tier.
Define workload categories using observable requirements: output structure, reasoning depth, domain risk, and review tolerance. A support platform could send billing classification to a compact model and complex technical questions to a more capable model. Reporting should expose route distribution, cost per request, quality by category, and the share of requests that require a stronger route.
Selection is an operating decision only when quality is measured against the outcome that matters. A cheaper classifier can raise total cost through escalations. A shorter summary can create downstream review work if it omits details. Track these effects in SpendLens AI by joining model events with retries, review status, and task outcomes.
Set selection criteria and decision metrics
Use a task-level scorecard:
- Cost per successful task: Include retries, stronger-model escalations, and human review where relevant.
- Quality threshold: Define the minimum acceptable result for each workload before routing begins.
- Latency profile: Track typical and tail latency for user-facing routes.
- Route mix: Show how workload volume is distributed across model tiers.
- Business outcome: Measure resolution, conversion, acceptance, or completion when available.
Review the scorecard on a fixed cadence and change one policy at a time. Expand a lower-cost route when it meets its threshold without shifting work downstream. Retain a stronger model when failures affect users or require manual correction. This turns reporting into evidence for product capacity, quality governance, and savings decisions, rather than a dashboard ranking models by unit price.
8. Tiered Model Routing and Fallbacks
A fallback policy is a reliability control, not a second model-selection strategy. It defines what the system does after a route fails, produces an unusable response, or becomes unavailable. SpendLens AI should record each trigger, destination, and outcome so operators can distinguish genuine provider incidents from faulty validation or overly aggressive escalation rules.
Set the failure sequence before deployment:
- Confidence threshold: Specify the score or condition that permits escalation, and record the threshold version with each request.
- Failure trigger: Classify invalid structure, missing fields, refusal, timeout, or evaluator failure separately. Each trigger points to a different remedy.
- Provider fallback: Define the substitute provider for rate limits, outages, or high latency. Include a maximum retry count and prevent repeated attempts from multiplying spend.
- Rollback path: Keep the prior route available through configuration, so operators can restore it without a code rewrite.
Fallbacks also need an exit condition. If the substitute route fails, the service should return a controlled error, queue the task, or request human review rather than retrying indefinitely. Record whether the final result came from the primary route, a retry, or another provider. That lineage supports incident review and accurate cost attribution.
Use a small audit sample to test the policy on a recurring cadence. Review trigger accuracy, recovery success, added cost, and user impact together. A fallback that increases spend slightly can still be justified when it prevents an unusable result, but the report must show the added calls and the avoided failure. Change one rule at a time, then compare failure causes before and after the change.
9. Tiered Model Selection, Monitoring, A/B Testing, and Metrics
A routing deployment is only the start of measurement. SpendLens AI should treat reporting as the operating system for attribution, optimization, governance, and executive action. It must show whether a route saves money, preserves quality, and avoids shifting spend into retries or fallback calls.
Prioritize tests by financial exposure and decision risk. Compare the current route with a candidate route using equivalent inputs, stable evaluation rules, and a recorded release version. A canary limits production exposure while analysts check whether observed changes come from routing rather than prompt edits, traffic mix, or product behavior.
Build a decision-ready monitoring scorecard
Report these dimensions together:
- Cost attribution: Assign spend to model tier, workload, feature, route, and release.
- Latency: Track p99 latency for chat and real-time suggestions, where tail behavior affects user experience.
- Quality: Select task-specific measures, such as similarity, structured accuracy, or reviewer acceptance.
- Business outcomes: Connect outputs to satisfaction, conversion, resolution, or completion when those measures are available.
- Release effects: Compare baseline and candidate periods, and document traffic, prompt, and product changes.
The cadence should match the decision. Engineers need request-level lineage and failed-evaluation samples; operators need recurring trend and anomaly reviews; executives need the conclusion, financial effect, and owner. This separation keeps one dashboard from serving incompatible purposes.
For statistical comparisons, preserve sample sizes, raw counts and percentages, matching summary statistics, p-values, confidence intervals, effect sizes, degrees of freedom, multiple-testing adjustments, missing-data handling, power analysis, software, and public code where applicable. These practices are outlined in guidance on reporting statistical results. The same evidence chain lets SpendLens AI connect a reported saving to the tested route and the operational decision it supports.
9-Point Comparison: Reporting Best Practices
| Technique | 🔄 Implementation Complexity | ⚡ Resource Requirements | ⭐ Expected Outcomes / 📊 Impact | 💡 Ideal Use Cases | Key Advantages |
|---|---|---|---|---|---|
| Implement Granular Cost Attribution Through Decorator-Based Tagging | Low–Moderate, single-line decorators but needs tagging taxonomy | Dev time to add decorators; minimal infra; no proxy latency | ⭐ High visibility; 15–25% identifyable savings; reduces investigation time ~75% | Multi-tenant SaaS, feature chargeback, cost driver discovery | Rapid deploy, no latency hit, privacy-safe metadata tags |
| Establish Daily Executive Spend Summaries With Trend Detection | Low, report automation + anomaly tuning | Analytics pipeline, report/email/Slack integration, anomaly models | 📊 Fast detection of spikes; saves 5–10 hrs/week; prevents 10–15% wasted spend | Leadership monitoring, early-warning for deploys or spikes | One-minute exec visibility; actionable, quantified recommendations |
| Conduct Cross-Model Comparison Testing With Confidence-Weighted Recommendations | Moderate–High, A/B framework and test orchestration | Test traffic, labeled datasets, engineering time for harnesses | ⭐ Data-driven model switches; 20–40% savings per workload; faster selection | High-cost workloads, avoiding vendor lock-in, model migrations | Confidence scores + risk assessment drive prioritized tests |
| Identify and Eliminate Prompt Waste Via Template Analysis and Context Audits | Low–Moderate, tooling + prompt-engineering expertise | Sampling tools, prompt engineers, QA for regressions | 📊 15–35% input token reduction; quick ROI (weeks) | Token-heavy flows, long-context prompts, few-shot templates | Privacy-safe analysis; reduces cost without model changes |
| Deploy Prompt Caching Strategies for High-Volume Repetitive Context | Moderate, restructure prompts + integrate provider cache | Cache integration (provider-native), invalidation logic, small dev effort | ⚡ 75–90% savings on cached tokens; lower latency for hits | Large static context (legal docs, codebases, multi-turn chat) | Dramatic cost & latency reduction; enables expensive models cost-effectively |
| Establish Cost Ownership and Budgeting Frameworks by Project and Feature | Moderate, governance, tagging discipline, review cadence | Dashboards, tagging policy, owners, monthly review meetings | 📊 10–20% cost reduction within a quarter; forecasting & accountability | Org-level cost control, chargeback, budgeting cycles | Aligns spend to value; proactive alerts and chargeback models |
| Implement Tiered Model Selection Based on Task Complexity and Quality Requirements | Moderate, routing logic + complexity detection | Inference-layer routing, monitoring, fallback mechanisms | ⭐ 30–50% median cost reduction while preserving quality | Mixed-complexity workloads (chat, support, generation) | Cost-efficient routing; preserves quality for hard tasks |
| Tiered Model Routing and Fallbacks (Implementation Guidance) | Moderate, classifier + routing + fallback policies | Labeled data, A/B tests, retry/fallback controls | 📊 Rapid cost savings when tuned; potential added latency on fallbacks | Teams building routing layers that need practical playbooks | Confidence-based fallbacks; implementable without upstream changes |
| Tiered Model Selection, Monitoring, A/B Testing, and Metrics | Moderate, measurement & validation focus | A/B test harness, labeled signals, dashboards, metrics storage | ⭐ Ensures savings without quality loss; validates 30–50% reductions on eligible requests | Validation of routing policies, guardrails for production rollouts | Empirical validation, regression alerts, p99 latency monitoring |
Turn Reporting Into a Weekly Savings Loop
LLM spend reporting works when it becomes a repeatable operating rhythm. Start by instrumenting three high-value tags, such as project, feature, and environment. Use metadata-only privacy defaults, hash API keys, and sample prompt templates without storing user prompts or model responses by default. This creates useful attribution while limiting unnecessary data collection.
Next, build a dashboard around spend and unit economics. Show provider, model, workload, feature, token usage, cache efficiency, cost per call, and business value where available. A dashboard should help an owner answer a question, not merely display a chart. A benchmark compilation reports that dashboards had reached broad enterprise adoption by 2023, while another survey summary reports uneven satisfaction and decision support. The operational lesson is clear: speed and availability don't compensate for missing context or unclear action. See the dashboard adoption and performance compilation and the dashboard user experience survey summary for the underlying figures.
Send role-specific daily summaries next. The CFO can receive total spend and trend, engineering can receive drivers and recommendations, and product managers can receive feature-level cost and value. Every summary should include a measurable outcome. That might be time saved, money saved, avoided prompt waste, quality preserved, or latency changed.
Review the highest-confidence savings recommendation every week. Use a baseline-versus-after format. For example, a finance team that reduced monthly management-report preparation from 40 hours to 5 hours saved 35 hours per month. At €50 per hour, that equals €1,750 per month and €21,000 per year, as shown in this financial reporting automation example. The formula is simple: human-equivalent time per task multiplied by completed tasks. A separate automation measurement example converts 100 tasks at 15 minutes each into 1,500 minutes, or 25 hours, then monetizes the result using the hourly rate.
Report gross and net savings separately. Gross savings can include labor time, while net savings subtracts implementation cost and adds vendor-fee or error-remediation reductions where relevant. A management reporting framework recommends translating hours into FTE savings and using fully loaded hourly cost. For infrastructure optimization, the AWS Well-Architected cost guidance gives a baseline example where a workload falls from $100,000 to $80,000, creating $20,000 in savings without reducing quality or output.
SpendLens AI can support this loop with @spendlensai.observe, track(), and client.tag() for instrumentation, workload classification for comparable operations, cache metrics for repeated context, model recommendations ranked by estimated savings and risk, and executive summaries for daily action. The platform works with standard OpenAI and Anthropic clients, sends calls directly to providers, and surfaces spend by project, provider, model, and workload without requiring a proxy.
The strongest report isn't the one with the most charts. It's the one that lets a named owner decide what to change, measure the result, and explain the value in terms the next stakeholder can use.
SpendLens AI helps engineering and FinOps teams attribute OpenAI and Anthropic spend, identify prompt and cache waste, compare model-switch opportunities, and produce executive-ready summaries. Visit SpendLens AI to instrument an existing Python service, inspect its LLM cost drivers, and turn the next reporting cycle into a measurable optimization plan.