LLM Pricing Comparison: Real Costs and Savings for 2026
An apples-to-apples LLM pricing comparison covering per-token rates, caching, real workload costs, and optimization strategies to cut your AI bill.
BenchLM's August 2026 tracker puts the median LLM API price at $1.00 per 1M input tokens and $3.80 per 1M output tokens across 142 tracked models BenchLM pricing statistics. That gap is the first warning sign for any LLM pricing comparison, because output is still the expensive side of the bill, and small changes in response length can dominate spend at scale.
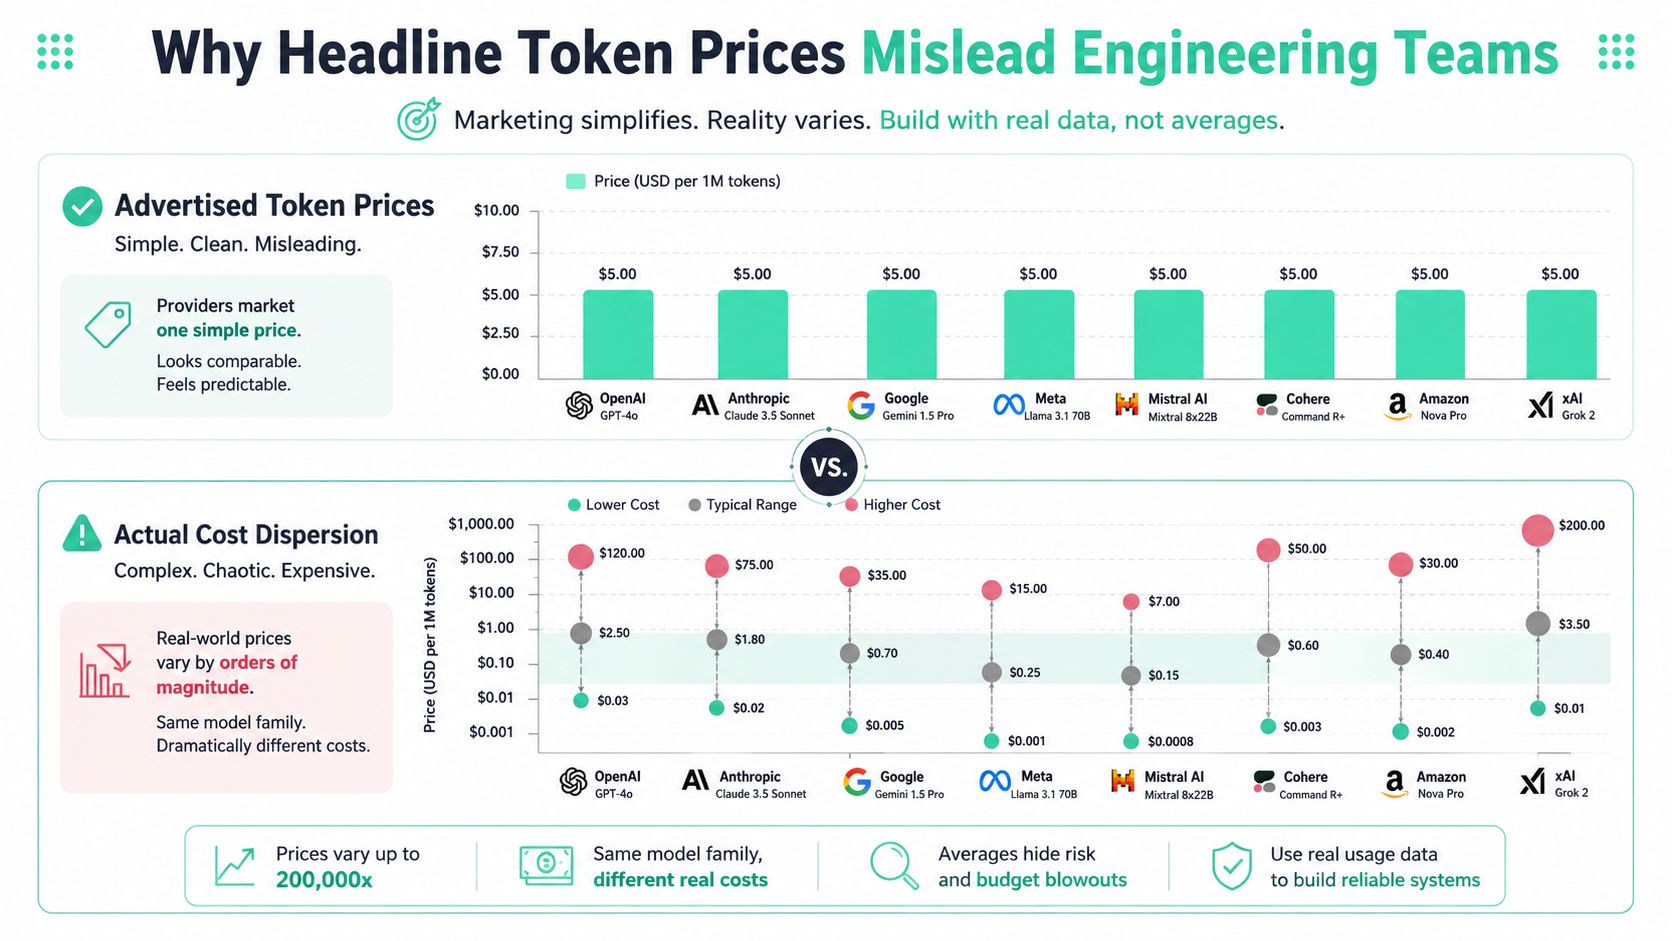
The bigger surprise is dispersion. BenchLM also reports that the most expensive tracked model, o1-pro, was priced at roughly 4,773x the blended 1M-token cost of the cheapest model, Qwen3.7 Flash BenchLM pricing statistics. In other words, teams are not choosing between “cheap” and “expensive” in the abstract, they're choosing between radically different cost structures for the same business workflow.
| Model | Tier | Input Price per 1M | Output Price per 1M | Benchmark Score |
|---|---|---|---|---|
| Qwen3.7 Flash | Cheapest tracked model | $0.03 | $0.13 | Not provided in verified data |
| Grok 4.5 | Cheap production-grade option | $2.00 | $6.00 | 70+ |
| Kimi K3 | Cheapest frontier-tier option | $3.00 | $15.00 | 80+ |
Table of Contents
- Why Headline Token Prices Mislead Engineering Teams
- Comparing Model Families Across Capability Tiers
- The Real Cost Metric Teams Should Compare
- Real Workload Cost Scenarios and Savings Examples
- A Methodology for Fair LLM Cost Comparisons
- Optimization Strategies That Reduce Actual Spend
- Building Continuous Cost Visibility Into Your Workflow
Why Headline Token Prices Mislead Engineering Teams
A clean price card hides most of the cost. BenchLM's market snapshot shows extreme price dispersion across 142 tracked models, and that spread is wide enough to break any assumption that LLM pricing behaves like a commodity market BenchLM pricing statistics.
The wrong comparison unit creates false confidence
A model can look efficient on paper and still generate a larger invoice than a smaller alternative. List price does not capture how a workload uses the model, especially when outputs are long, prompts repeat, or routing sends the wrong task to the wrong tier. That is why a llm pricing comparison based only on headline token rates gives engineering teams a false sense of control.
The market also does not move as a single block. Artificial Analysis reports Llama 3.1 Instruct 8B at $0.02 per 1M tokens blended, while Nova Micro and Sarvam 30B (high) sit at $0.03 per 1M tokens Artificial Analysis models. Those figures sit in the same general budget band, but they still leave room for material differences once output mix and routing behavior are included. For the practical cost view, see why token counts alone don't tell the full story.
Practical rule: if two models meet the same quality bar, compare the one that matches your workload shape, not the one with the most appealing sticker price.
BenchLM's broader tracker adds another signal. Over the 12 months to August 2026, the frontier LLM Token Price Index rose 36.4% year over year, while mid-tier prices fell 35.8% Artificial Analysis models. That split shows frontier pricing behaving like a premium segment, while mid-tier capacity is becoming relatively cheaper for routine work.
The market is tiered, not flat
BenchLM's capability tiers make the cost curve easier to read. The cheapest API model it tracks is Qwen3.7 Flash at $0.03 per 1M input tokens and $0.13 per 1M output tokens, while the cheapest production-grade model at score 70+ is Grok 4.5 at $2.00/$6.00, and the cheapest frontier-tier model at score 80+ is Kimi K3 at $3.00/$15.00 BenchLM llm pricing. That is a steep step function, not a smooth progression.
For engineering teams comparing vendors, the implication is direct. If the task does not need frontier reasoning, the premium buys less value than most dashboards suggest. A better first cut is to separate routing, classification, and extraction from higher-stakes reasoning, then compare each workload against the tier it needs.
Comparing Model Families Across Capability Tiers
A tiered market creates tiered economics. The cheapest model is only a real bargain if it clears the task with acceptable error rates, stable latency, and low retry volume. For engineering teams, the useful comparison is not which provider has the lowest sticker price, it is which model family keeps the effective per-call cost lowest for the work you run.
Budget and mid-tier options
The low end of the market still offers room for direct spend reduction, especially on routing, extraction, and other repetitive tasks. Models such as Llama 3.1 Instruct 8B, Nova Micro, and Sarvam 30B (high) sit near the lowest price bands, while Qwen3.7 Flash is also positioned at the budget end with very low input and output rates. The important point is operational, not cosmetic. If the workload is deterministic enough, teams can often move it down a tier without changing the product experience.
| Model | Tier | Input Price per 1M | Output Price per 1M | Benchmark Score |
|---|---|---|---|---|
| Llama 3.1 Instruct 8B | Budget | $0.02 blended | Not provided in verified data | Not provided in verified data |
| Nova Micro | Budget | $0.03 blended | Not provided in verified data | Not provided in verified data |
| Sarvam 30B (high) | Budget | $0.03 blended | Not provided in verified data | Not provided in verified data |
| Qwen3.7 Flash | Budget | $0.03 | $0.13 | Not provided in verified data |
| Grok 4.5 | Production-grade | $2.00 | $6.00 | 70+ |
That table shows why provider comparisons alone are misleading. A team that only looks at brand reputation can miss the fact that several lower-cost models sit in the same practical tier for retrieval, classification, and structured extraction. A better filter is task fit. If the model only needs to identify intent, extract fields, or route requests, paying for a much stronger family often adds cost faster than it adds value.
Frontier models carry a steep premium
Frontier models sit on a different part of the curve. BenchLM lists Kimi K3 as the cheapest frontier-tier model, and its price level makes the trade-off clear for leadership teams evaluating high-stakes reasoning workloads. At that tier, price is less about a marginal uplift and more about whether the task needs advanced reasoning, long context handling, or tighter answer quality under ambiguity.
OpenAI, Anthropic, and Google also sit inside this tiered structure, but the pattern is the same across vendors. Higher benchmark quality tends to arrive with a steep price jump, not a smooth incline. That is why “best model” is usually the wrong question. The right question is which tier the workload belongs in, and whether a higher tier is reducing rework, escalation, or human review enough to justify the spend.
Operational takeaway: keep budget models on routing, extraction, and other high-volume deterministic tasks. Reserve frontier models for complex reasoning, ambiguous instructions, and cases where a wrong answer costs more than the call itself.
If your team still needs a broader shortlist after mapping tasks to tiers, the best AI LLM guide can help narrow the candidates before you compare effective call cost.
The Real Cost Metric Teams Should Compare
Per-million-token rates are only a starting point. Engineering teams should compare effective per-call cost, because the bill changes with cache hit rates, output-share, and routing or fallback behavior. A model with a higher list price can still be cheaper for finished work if most of the prompt is reused or the output is short. That is the comparison that separates sticker price from actual spend.
Cache and output mix change the equation
Cached input is the clearest example. One 2026 comparison table lists GPT-4.1 at $2.00 per million input tokens, $0.50 per million cached input tokens, and $8.00 per million output tokens, while GPT-4o is listed at $2.50, $1.25, and $10.00 respectively. For repetitive prompts, static instructions, and long system prefixes, cached tokens can lower the all-in bill enough to change the model choice.
A pricing table without cache treatment is incomplete for any repetitive workload.
Output mix is the second blind spot. BenchLM's pricing statistics show that output tokens still cost more than input tokens across mainstream API pricing, with the median at $3.80 per 1M output tokens versus $1.00 per 1M input tokens. If an application emits long responses, output cost quickly becomes the main driver even when input looks inexpensive.
Measure the completed call, not the prompt
A 2026 guide warns that per-million-token pricing is not the same as per-call cost and recommends measuring canonical dollar cost after cache and routing adjustments. That matters for customer support, document review, and agent workflows, where prompt reuse, tool calls, and fallback logic all change what gets billed. The right unit is the completed business task, not the prompt template.
That framing also shows why teams should use an API cost comparison method instead of comparing list prices in isolation. If two models resolve the same request, the cheaper one is the one with the lower effective cost after cache reuse, output mix, and routing are included. Anything else can make a higher-priced model look cheaper, or a cheaper model look better than it really is.
Real Workload Cost Scenarios and Savings Examples
A pricing sheet only becomes decision-grade once it is tied to a real workload. The useful question is whether a model switch lowers the completed-call bill enough to justify migration work, or whether prompt trimming and cache reuse can defer that change entirely.
High-volume batch processing can swing by multiples
The math changes quickly in repetitive batch jobs. One guide estimates that 1 million requests of a 2,000-input / 400-output-token workload costs $72 on Alibaba Cloud Qwen 3 4B versus $540 on OpenAI GPT-4o Mini Silicon Data cost per token. That is a $468 difference for the same workload, or roughly 6x higher cost for GPT-4o Mini in that example Silicon Data cost per token.
That spread is most relevant where the workload is stable and repeated. Classification, routing, tagging, and document extraction usually do not need the highest-end reasoning model, so the wrong tier shows up as recurring waste rather than one-off experimentation. If the task is predictable, the pricing mistake is not theoretical, it becomes a monthly line item.
Chatbots turn output mix into monthly spend
Support chat is a different cost profile. A chatbot handling 100,000 conversations per month with 500 input tokens and 200 output tokens per conversation costs about $368 per month on GPT-5.2 Inference.net pricing comparison. That gives engineering and FinOps teams a concrete baseline for a live support workload instead of a token chart that ignores actual call shape.
Response length is the lever that moves this workload. Shorter answers reduce spend, but they can also reduce completeness and increase follow-up turns. Longer answers can improve coverage while raising monthly cost at the same time. A pricing review that skips sample conversations will miss that trade-off and understate the true bill.
Savings come from matching model to task
The practical conclusion is straightforward. Route routine work to lower-cost models, and reserve premium models for the cases that need them. In batch pipelines, the savings can be large because the task is repetitive. In support bots, the savings usually come from tighter prompts, shorter outputs, and avoiding unnecessary generation.
The biggest overruns happen when teams pay premium rates for routine calls. A cheaper model is not automatically the lower-cost option if it drives more retries or worse routing decisions, but the opposite mistake is more common, premium capacity used where a simpler model would finish the job at a lower effective cost.
A Methodology for Fair LLM Cost Comparisons
A fair comparison starts with the workload, not the vendor list. If a team has not agreed on the task, the input shape, and the quality bar, the pricing exercise will drift toward whichever model looks cheapest on paper. That is a common mistake, and it can become an expensive one once the system is live.
Measure the same task across candidates
Start by defining the unit of work in business terms. A support reply, a classification decision, a summary, and a code suggestion are different tasks, even if they all consume tokens. Once the task is fixed, measure input and output tokens on representative samples for each candidate model.
Then capture retry behavior and fallbacks. A model with lower per-token pricing can still end up more expensive if it needs more reruns or fails more often. Compare results on the same prompt set, the same temperature settings, and the same acceptance criteria so the comparison reflects the same operating conditions.
Add the hidden costs before you decide
API rate is only one part of the bill. Analysts at BenchLM found that standardized prompts across five rounds, using first-token latency, output throughput, and total response time, expose the speed component of serving cost in BenchLM llm price-performance. A model with attractive pricing but weak throughput can still raise effective spend if it slows user flows or consumes more serving capacity.
Good procurement rule: do not approve a cheaper model until you have tested its latency, failure rate, and output quality on your own workload.
Cache and routing belong in the same evaluation. If your workload has repeated prefixes, compare cached-token pricing alongside standard rates. If your application can route simple requests to smaller models, include the routing logic in the test, not after it. That is where many comparisons go wrong, because the headline rate looks favorable while the live call pattern still drives the larger bill.
Use the right reference point for migration risk
The final step is quality thresholding. A fair comparison does not ask whether a model is “good.” It asks whether it clears the specific bar required for the feature, the customer segment, and the error tolerance. That keeps engineering teams from paying for extra quality they do not need.
The cost of multi-turn conversations is a useful reminder that each turn adds more context and more spend, so the test should reflect the full interaction pattern, not a single prompt in isolation. A model that looks efficient in one-shot testing can become expensive once the conversation length is included.
Optimization Strategies That Reduce Actual Spend
The clearest savings come from changing routing behavior before changing providers. A team that shifts routine work to cheaper models, trims unnecessary context, and applies cache effectively can reduce monthly spend without changing the application's core value. The hard part is matching the lever to the workload.
Start with model downgrades for routine work
Model downgrading fits tasks with stable output expectations. Classification, extraction, short-form summarization, and basic support replies are the usual candidates. The market spread makes this meaningful, because lower-tier models often sit far below frontier systems on both input and output pricing.
Trim prompts before chasing infrastructure changes
Prompt trimming is often the fastest win. Large templates, repeated instructions, and unnecessary context all inflate token usage, and that cost repeats on every request. If the workload includes many short interactions with similar structure, reducing prompt bloat usually saves more money than changing providers.
Use caching where the prompt repeats
Cache-aware pricing is one of the few levers that directly reduces repeated input cost. As noted earlier in the comparison of cache behavior in the 2026 comparison table, cached input can be far cheaper than uncached input for models such as GPT-4.1 and GPT-4o. That makes caching especially useful for static policy text, long system prompts, and repeated retrieval scaffolding.
The gain depends on repeat rate. If the same prefix is sent over and over, cache hits can turn a high-cost prompt into a much cheaper one, while one-off requests see little benefit.
Route by complexity, not habit
Routing usually produces the largest savings. Simple calls can go to cheaper models, frontier models can stay reserved for harder cases, and escalation can happen only after a defined quality check fails. Teams overpay when they default every request to a premium model because it feels safer than setting a routing policy.
For multi-turn products, routing should also reflect conversation length, because each extra turn raises token footprint and effective spend, as described in the cost of multi-turn conversations. Chat products usually benefit more from hybrid routing than single-shot tools, because they accumulate context faster and expose more opportunities to direct easy turns to lower-cost models.
Building Continuous Cost Visibility Into Your Workflow
A pricing comparison becomes stale quickly. Providers change rates, release new models, and shift the economics of caching and long-context usage. A static spreadsheet cannot keep pace with that movement, and it will not show which feature, team, or workload is driving the bill.
Attribute spend to features and workloads
The operating model that holds up in production is continuous visibility. Track spend by feature, workflow, and customer segment so engineering can see which requests are inexpensive, which are costly, and which are drifting upward after a release. That attribution turns invoices into engineering signals instead of finance surprises.
It also makes the hidden cost differences visible. A feature that looks cheap on paper can become expensive if it sends long prompts, produces oversized outputs, or misses cache reuse. Once spend is broken down by workload, teams can compare effective per-call cost instead of relying on headline token rates that do not reflect actual usage.
Catch spikes before finance does
Cost spikes usually appear after a prompt change, a routing bug, or a product launch that increases output length. Daily visibility lets the team correct the problem while the blast radius is still small. Waiting for the monthly invoice means the overrun is already locked in.
That same monitoring also helps isolate whether the problem is model choice or workload shape. A sudden jump in cost may come from a model that is being used for the wrong class of request, or from a feature that now carries more context through every turn. If engineering can see that pattern early, it can route simpler calls elsewhere, trim unnecessary context, or tighten the output budget before spend drifts further.
Make comparison a routine, not a project
Continuous monitoring keeps model-switch opportunities visible. A model that was borderline six months ago may no longer be the best choice if a cheaper tier has improved or the workload has shifted. FinOps teams should treat LLM cost review as part of production operations, not as a quarterly audit.
The practical goal is a comparison loop that follows the workload, not the vendor release cycle. That means reviewing cache hit rates, output ratios, and routing outcomes together, then checking whether the effective cost per call still matches the value of the feature. Teams that do this regularly can spot overpayment early, move routine traffic to lower-cost models, and reserve premium models for the requests that need them.
If you want that visibility without turning your engineering team into a manual spreadsheet factory, SpendLens AI adds lightweight instrumentation for OpenAI and Anthropic workloads, shows spend by project and model, and highlights cache efficiency and model-switch opportunities. Visit SpendLens AI to see how it can turn your LLM spend into something you can manage.