IT Financial Management: A Practical Roadmap for 2026
Learn IT financial management in 2026 with clear steps for budgeting, chargeback, FinOps, and AI cost control. Real examples and a roadmap inside.
You can ship a feature that looks brilliant in product review and still get blindsided when finance asks why the AI bill jumped overnight. That's the moment many teams realize the problem isn't cost itself, it's that nobody can trace the cost back to a service, a team, or a business result. IT financial management exists to close that gap, and in 2026 it has to do more than track servers, licenses, and cloud invoices. It has to make sense of LLM spend, too, where one prompt change or model switch can turn a clean forecast into a monthly surprise.
The market pressure is real. One global estimate values the IT Financial Management market at $4.2 billion in 2025 and projects $9.1 billion by 2034, with a 9.8% CAGR over 2026 to 2034, and says Solutions make up 68.5% of the market, which tells you software platforms are doing the heavy lifting rather than services alone. A separate estimate puts IT Financial Management Tools at USD 4.23 billion in 2023, USD 4.75 billion in 2024, and USD 9.75 billion by 2030, at a 12.66% CAGR. MarketIntelo and GII Research point in the same direction, organizations want tighter control over technology spend because the spend itself keeps getting more complex.
Table of Contents
- When the AI Bill Becomes the Wake-Up Call
- What IT Financial Management Actually Means
- The Four Mechanics That Make ITFM Work
- Showback Versus Chargeback and Why the Choice Changes Behavior
- Applying FinOps to Cloud and AI/LLM Spend
- A Worked Example Cutting LLM Spend by 38 Percent
- The KPIs That Tie ITFM to Business Outcomes
- A 90-Day ITFM Implementation Roadmap
When the AI Bill Becomes the Wake-Up Call
The first sign usually isn't a strategy memo. It's a Slack message from a product manager who just saw an AI invoice that doesn't match the release plan, followed by a finance question nobody can answer cleanly. The feature did ship, the users did adopt it, and the OpenAI or Anthropic charges did rise, but the team can't say which workflow caused the spike or whether the new behavior was worth it.
That's where IT financial management stops being an accounting topic and becomes an engineering discipline. If you can't attribute spend to a service, a consuming team, and a business outcome, then every optimization discussion starts with guesswork. The invoice arrives first, the explanation comes later, and by then you're already defending what happened instead of steering it.
The hard part is that this isn't only an AI problem. The same visibility gap shows up in cloud, licensing, and shared platform costs, which is why mature ITFM practices treat cost traceability as the starting point, not the finishing touch. A team can't optimize what it can't name, and it can't govern what it can't trace.
Practical rule: if you need three people and two spreadsheets to explain one cost spike, the model is already too weak for executive review.
For engineering managers, the takeaway is simple. Don't wait for the first painful invoice to force discipline. Put the traceability model in place before the next feature launch, because every day spent with invisible spend is a day where your estimates, priorities, and trade-offs are less trustworthy than they should be.
What IT Financial Management Actually Means
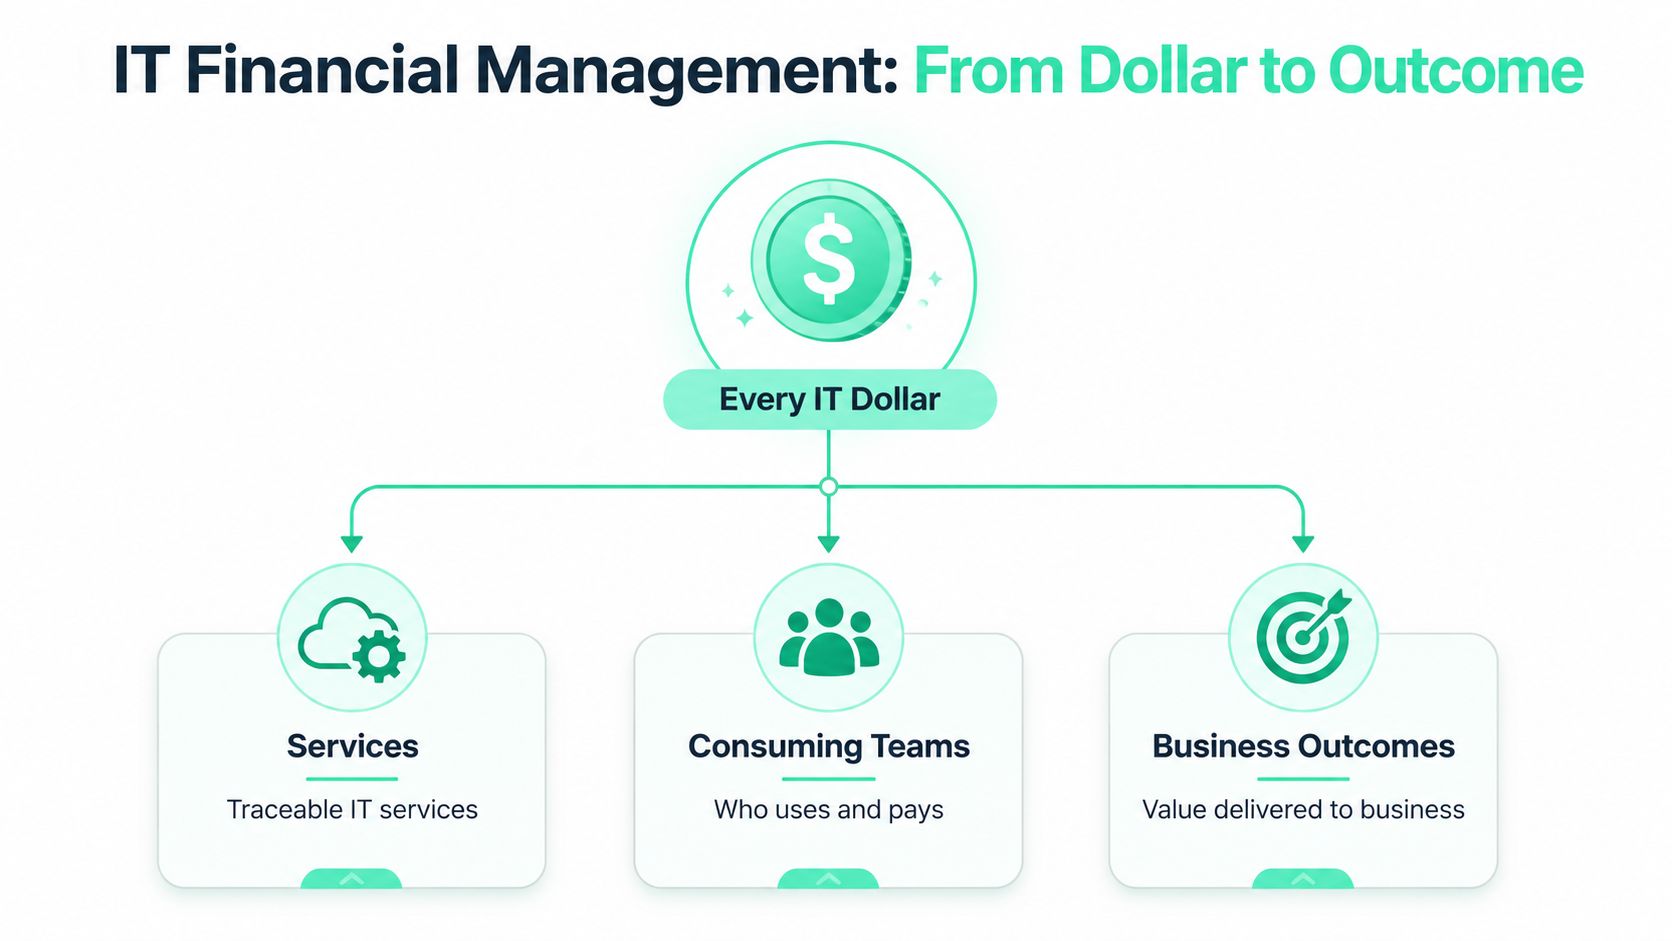
IT financial management is the discipline that makes every IT dollar traceable to a service, a consuming team, and a business outcome. That's a much stronger standard than “we know roughly what the budget was.” It turns spend from a generic line item into decision-grade accountability, which is what finance, engineering, and product teams need when they argue about priorities.
Start with a shared cost taxonomy
The part that trips teams up is not tooling, it's classification. Finance often thinks in pools like labor, hardware, software, cloud, and facilities, while IT may think in towers like applications, network, end-user computing, and data centers. If those labels don't line up, the same expense gets grouped three different ways, and the report loses credibility before anyone discusses allocation.
Start from the general ledger and map what's already visible to services and business units. Then close the gaps in taxonomy and allocation rules before layering on forecasting or optimization. That sequence matters because chargeback built on sloppy definitions just creates formal-looking noise.
Clean model, better debate: once finance and engineering agree on the same cost buckets, they spend less time arguing the numbers and more time deciding what to do with them.
If you want a budgeting companion to this model, the planning approach in this IT budget planning guide fits naturally, because budgeting without traceability quickly turns into a forecast nobody trusts. ITFM is the connective tissue. It links the ledger to the service catalog, then links the service catalog to the people and products that consume value.
The Four Mechanics That Make ITFM Work
The core mechanics are easy to name and hard to run well: budgeting, accounting, allocation, and reporting. Each one answers a different question, and if you blur them together, the process starts producing numbers that look precise but don't help anyone make a decision.
Take a containerized API service running on managed Kubernetes, plus a small LLM summarization step. Budgeting says what the service is expected to cost based on planned traffic, model usage, and infrastructure assumptions. Accounting captures the actual costs as they hit the ledger and provider bills. Allocation assigns those costs to the consuming product team or business unit. Reporting shows what changed, why it changed, and whether the pattern is acceptable.
One workload, four questions
- Budgeting: What do we think this API and summarization flow will cost next month?
- Accounting: What did the cluster, model calls, and support overhead cost?
- Allocation: Which team, feature, or department should carry the expense?
- Reporting: Where did variance show up, and what action should we take?
That flow depends on service recording and consistent cost categories. A framework from ITFM practice also allows actual costs, averages, or estimates, which matters when some parts of the stack are easy to measure and others are shared across multiple services. If your reporting mixes those methods without disclosure, leaders will read a single number that hides three different levels of certainty.
For a practical walkthrough of workload-level spend control, manage cloud cost is the right mental model to pair with the finance view. The key point is that reporting should not be a decorative dashboard. It should show how the workload moved through the system, from plan to actual to assignment to decision.
Showback Versus Chargeback and Why the Choice Changes Behavior
Showback and chargeback often get treated like policy labels, but they create very different behavior. Showback means teams see the cost, but no money moves between units. Chargeback means the consuming unit is billed or recharged for the cost, so the number lands with accounting weight behind it.
Here's the same workload in both models. A product team uses a shared AI summarization service. Under showback, the team sees its monthly usage and cost, then decides whether to reduce prompts, move tasks, or keep the current setup. Under chargeback, that cost is posted to the team's budget, which usually changes the conversation faster because the expense now competes with other priorities.
How the choice changes behavior
| Dimension | Showback | Chargeback |
|---|---|---|
| Who sees the cost | Consuming teams and leaders | Consuming teams, leaders, and finance |
| Money movement | None | Costs are billed or reallocated |
| Best use | Early maturity, visibility, behavior change | Mature governance, accountability, internal billing |
| Common risk | Teams ignore the number | Teams challenge the allocation model |
Showback is usually enough when the organization is still building trust in the data or learning what good attribution looks like. Chargeback becomes useful when the taxonomy is stable, the business units accept the model, and leadership wants stronger financial accountability. Mixing the two is where trouble starts, because people begin arguing over whether the dashboard is informational or billable.
A practical ITFM guide on service-level spend management aligns well with this choice, especially for teams deciding whether a usage pattern should stay visible or become a formal charge. The best rule is to earn chargeback. If the allocation logic isn't defensible yet, showback gives you the feedback loop without creating a monthly dispute ritual.
Applying FinOps to Cloud and AI/LLM Spend
A cloud bill can rise for one reason. An AI bill can rise for several at once. Cloud spend usually tracks traffic, environments, and architecture choices. LLM spend adds token volume, prompt length, model choice, and the question of whether the work really needs a premium model at all.
What to measure first
Start with instrumentation before optimization. Track calls by workflow, feature, experiment, or endpoint, then classify workloads so you can compare like with like across environments and releases. That gives you a clean baseline, which is the only way to tell whether a change improved efficiency or just shifted cost around.
The first waste usually shows up in large templates, repeated instructions, long outputs, and model upgrades that were made out of habit rather than need. A support summary sent to a premium model when a smaller one can handle it is a workload design problem as much as a cost problem. A prompt that repeats the same instructions in every call is an architectural issue, because the extra tokens are being paid for every time.
Don't optimize the provider bill first, optimize the request shape first. A cleaner prompt often saves more than a clever purchasing decision.
Lightweight decorators and tags help. They let teams attribute usage without forcing every request through a new proxy path. SpendLens AI, for example, instruments OpenAI and Anthropic calls with decorators and tags so teams can break spend down by project, provider, model, and workload, while also surfacing cache efficiency and prompt waste signals. That visibility matters because provider dashboards usually show the invoice, not the reasons behind it.
If you are fitting LLM usage into an existing governance process, the implementation patterns in service-level spend management carry over well to AI calls. The goal is to see more than the total spent. It is to know whether the spend mapped to the right model, the right workload, and the right business task.
A Worked Example Cutting LLM Spend by 38 Percent
A SaaS team rolled out document summarization inside a customer-facing workflow and routed most requests to a premium model. The feature performed well, adoption increased, and the bill climbed with the traffic. Finance asked for an explanation, and the team had usage totals, but not enough detail to separate productive calls from avoidable waste.
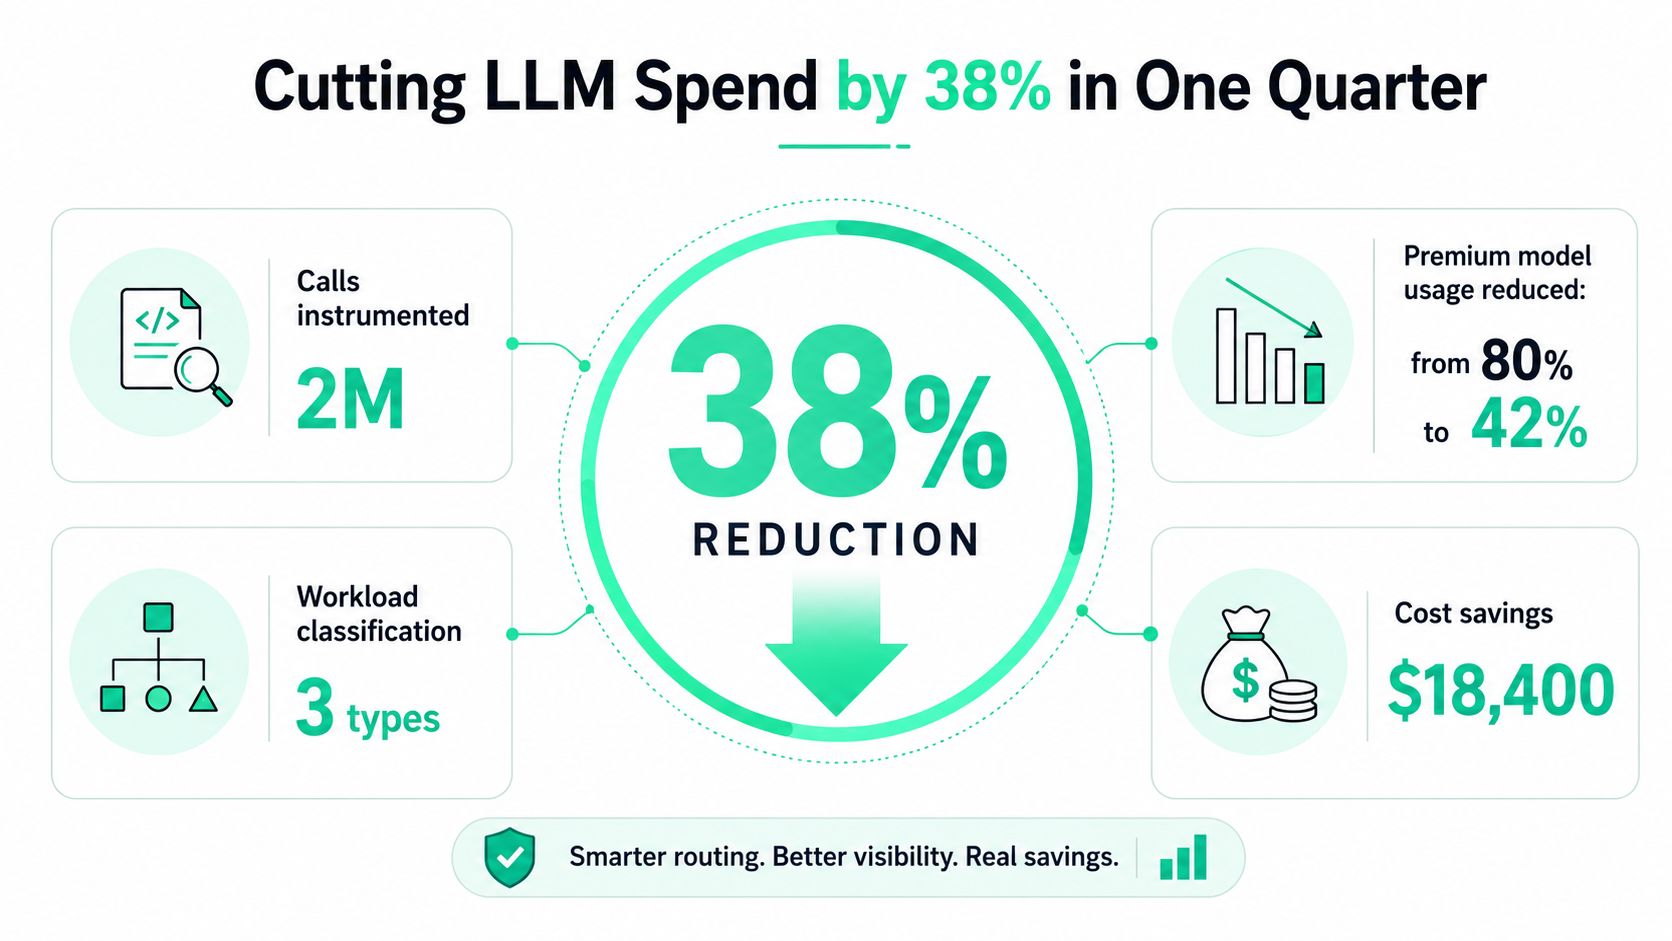
They began by instrumenting the calls and sorting the workload into three groups: simple summaries, medium-complexity customer notes, and edge cases that still needed the premium model. That made the first source of waste visible. The team found repeated instructions in the system prompt, trimmed them, and compared requests that needed the richer model with requests that had been routed there out of habit.
The biggest change came from model selection. Most requests shifted to a smaller model, while the premium model stayed reserved for the smaller set of tasks that justified it. Premium model usage dropped from 80% to 42%, and the team tracked $18,400 in cost savings over the quarter. The lesson was straightforward. The right calls stayed expensive, and the wrong calls stopped being expensive.
For teams that want a concrete instrumentation pattern, the same logic appears in endpoint request monitoring and tagging, because the cost signal only becomes useful after requests are tagged and grouped. That is the IT financial management link to AI spend control. Traditional budgeting, showback, and chargeback only work when the workload is legible, and LLM spend becomes legible only when you can attribute tokens, models, and workloads with enough precision to see where the waste lives.
The KPIs That Tie ITFM to Business Outcomes
Allocation tells you where the cost landed. KPIs tell you whether the cost made sense. If you only track spend, you'll end up optimizing for a smaller bill instead of a better business result, which is the fastest way to create false wins.
The dashboard worth building
- Cost per service: Shows what one service really consumes, which helps engineering compare release choices and support overhead.
- Budget variance: Highlights the gap between plan and actual, which finance needs for forecasting discipline.
- Spend as a percentage of revenue: Useful for leadership because it frames technology cost in business terms, not just IT terms.
- Unit economics per transaction or per user: Best for product and platform teams that need to understand scale effects.
- AI cost per successful outcome: The most useful AI metric when the goal is not cheap tokens, but a good answer, a completed workflow, or a resolved request.
These numbers work only if someone owns them. Engineering usually owns cost per service and unit economics, finance owns budget variance and revenue share, and product should care about AI cost per successful outcome because that metric can't be separated from quality. If one team owns all of them, no team owns them well.
A common mistake is to crush token usage and then degrade answer quality, which creates a cheaper failure. The better question is whether the outcome stayed strong while the cost moved down. That's the difference between a reporting exercise and a real value engine, the gap analyst guidance keeps calling out in modern IT finance thinking.
A 90-Day ITFM Implementation Roadmap
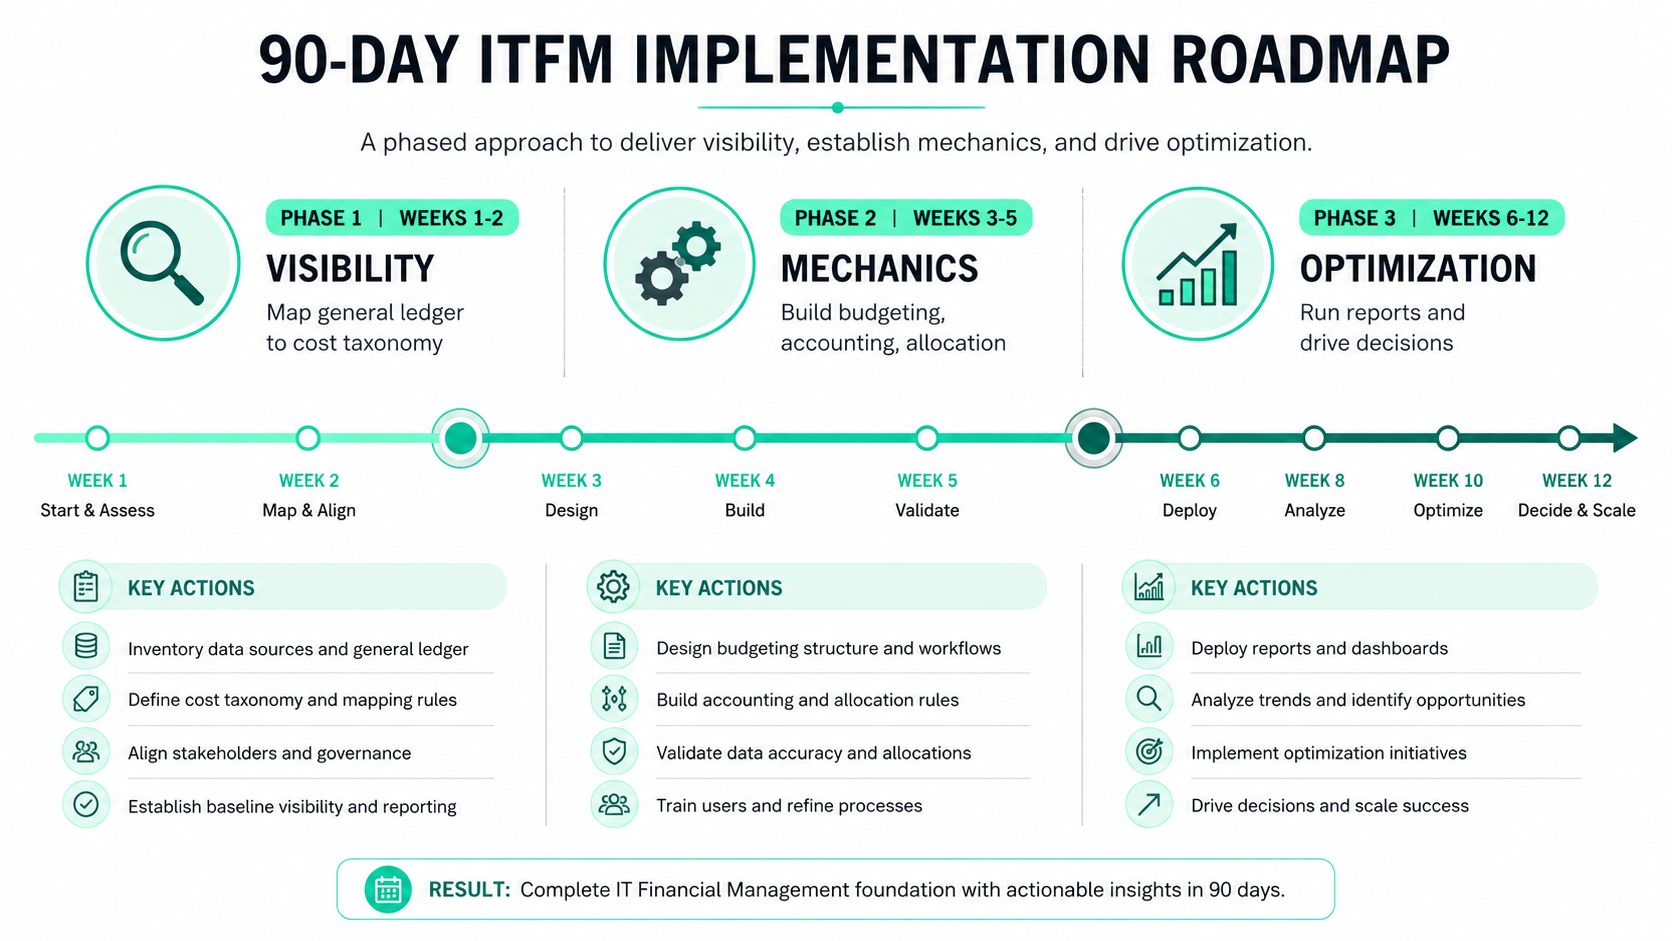
Weeks 1 and 2 should be about visibility, not perfection. Pull the current-state data from the general ledger, pick one cost taxonomy, and define how labor, software, cloud, and facilities should be grouped. If the names aren't stable yet, no report you build later will feel trustworthy.
Weeks 3 to 5 are about mechanics. Build the service catalog, set tagging standards, and produce the first showback report for one service or product area. That's the point where finance and engineering can compare the same cost from different angles without arguing over the definition of the number.
What to add by week 12
- Weeks 6 to 8: add forecasting, threshold alerts, and a weekly executive summary so variances surface before the month closes.
- Weeks 9 to 12: pilot chargeback for one or two services, then wire in LLM instrumentation with @spendlensai.observe, client.tag(), and cache-efficiency reporting for the AI layer.
- By day 90: leaders should be able to trace a cost from ledger to service to team, explain the biggest variance, and name the next action without opening five dashboards.
Programs usually stall for three reasons. The taxonomy keeps changing, the tagging rules aren't enforced, or the team tries to launch chargeback before showback has earned trust. Keep the first rollout narrow, especially if you're adding AI usage into the same governance model, because the point is clarity, not ceremony.
If you want a lightweight way to attribute LLM calls while you build the rest of the model, SpendLens AI fits that instrumentation layer. Visit SpendLens AI to see how its decorators, tags, and spend breakdowns can help your team trace AI usage to workflows, spot prompt waste, and bring real accountability to model spend.