Attribution vs Contribution for LLM Cost Visibility
Attribution vs contribution explained for LLM costs — learn when to prove cause vs share credit, with tagging patterns and FinOps examples.
Finance forwards an OpenAI or Anthropic invoice after a release, and the total is suddenly higher than expected. The first question is usually simple: which team, feature, endpoint, or prompt change caused the increase? The answer often isn't simple, because one bill can reflect a new workflow, longer context, retries, model selection, cache behavior, and changing traffic at the same time.
That's why a single total isn't cost visibility. Token counts tell you what the provider processed, but they don't automatically explain who initiated the work, what changed, or which recurring conditions keep making the workload expensive. LLM FinOps needs two lenses: attribution for causal ownership and contribution for the broader mix of drivers.
| Question | Best lens | Evidence standard | Typical action |
|---|---|---|---|
| Which workflow caused this bill spike? | Attribution | Direct linkage and a counterfactual | Roll back, isolate, or fix the change |
| Which teams should receive chargeback? | Attribution | Reliable tags and allocation rules | Allocate spend by owner or feature |
| Why is a workload consistently expensive? | Contribution | Triangulation across multiple drivers | Reduce prompt waste, retries, or model cost |
| Which optimization should we prioritize? | Contribution, verified with attribution | Plausible driver analysis plus controlled testing | Run the highest-confidence savings experiment |
Table of Contents
- Why LLM Bills Need Both Attribution and Contribution
- What Attribution and Contribution Mean for LLM Spend
- How Measurement Methods Differ in Practice
- Instrumentation Patterns That Enable Cost Visibility
- Real World Scenarios Where Each Approach Wins
- Trade Offs and How to Choose the Right Method
- Recommended Best Practices for FinOps and Engineering Teams
Why LLM Bills Need Both Attribution and Contribution
A team sees the invoice jump after a prompt release. Engineering checks request volume and discovers that traffic isn't the only change. The new template carries more context, some calls retry after timeouts, and a workflow that previously used a lower-cost model now routes complex-looking requests to a more expensive one. Finance wants one owner. The system has several interacting causes.
Attribution answers the narrow question: did this specific release or workflow cause the observed increase? In evaluation research, attribution requires a counterfactual claim. You need to compare what happened with what plausibly would have happened without the intervention, as described in the Canadian evaluation reference on attribution and contribution. For an LLM bill, that might mean comparing the released prompt with the prior template while holding workload and traffic conditions as constant as practical.
Contribution asks a different question: which factors meaningfully participated in the cost outcome? Prompt length, retries, model choice, cache misses, and output verbosity can all matter without any single factor explaining the entire bill. Contribution analysis accepts multiple causes and builds a credible explanation through theory, process evidence, and triangulation, rather than claiming exclusive ownership.
The cost of asking the wrong question
Suppose an endpoint is tagged correctly and receives most of the allocated spend. That doesn't prove the endpoint is inefficient. It may serve the highest-value or most complex feature. Conversely, a prompt template may appear responsible for a large token total while retries and cache misses make the actual avoidable cost much larger.
A team using attribution for every optimization can over-credit the most visible touchpoint. A team using contribution analysis for an urgent spike can spend days assembling a broad narrative when it needs a fast causal check. The method should follow the decision, not the other way around.
Why token totals aren't enough
Provider invoices and request logs usually show usage, model, and pricing dimensions. They don't preserve the business context needed to distinguish a customer-facing feature from an internal experiment or a retry generated by infrastructure. A useful operating model links each call to a workflow and preserves enough context to compare releases, providers, models, and workload classes.
The practical payoff is time saved during incident response and money saved through targeted changes. Attribution narrows the search. Contribution explains the system around the suspected cause. Used together, they prevent both false blame and unfocused optimization.
What Attribution and Contribution Mean for LLM Spend
Start with the outcome. If the outcome is a bill spike, cost per request, or monthly spend assigned to a team, write that outcome down before choosing a method.
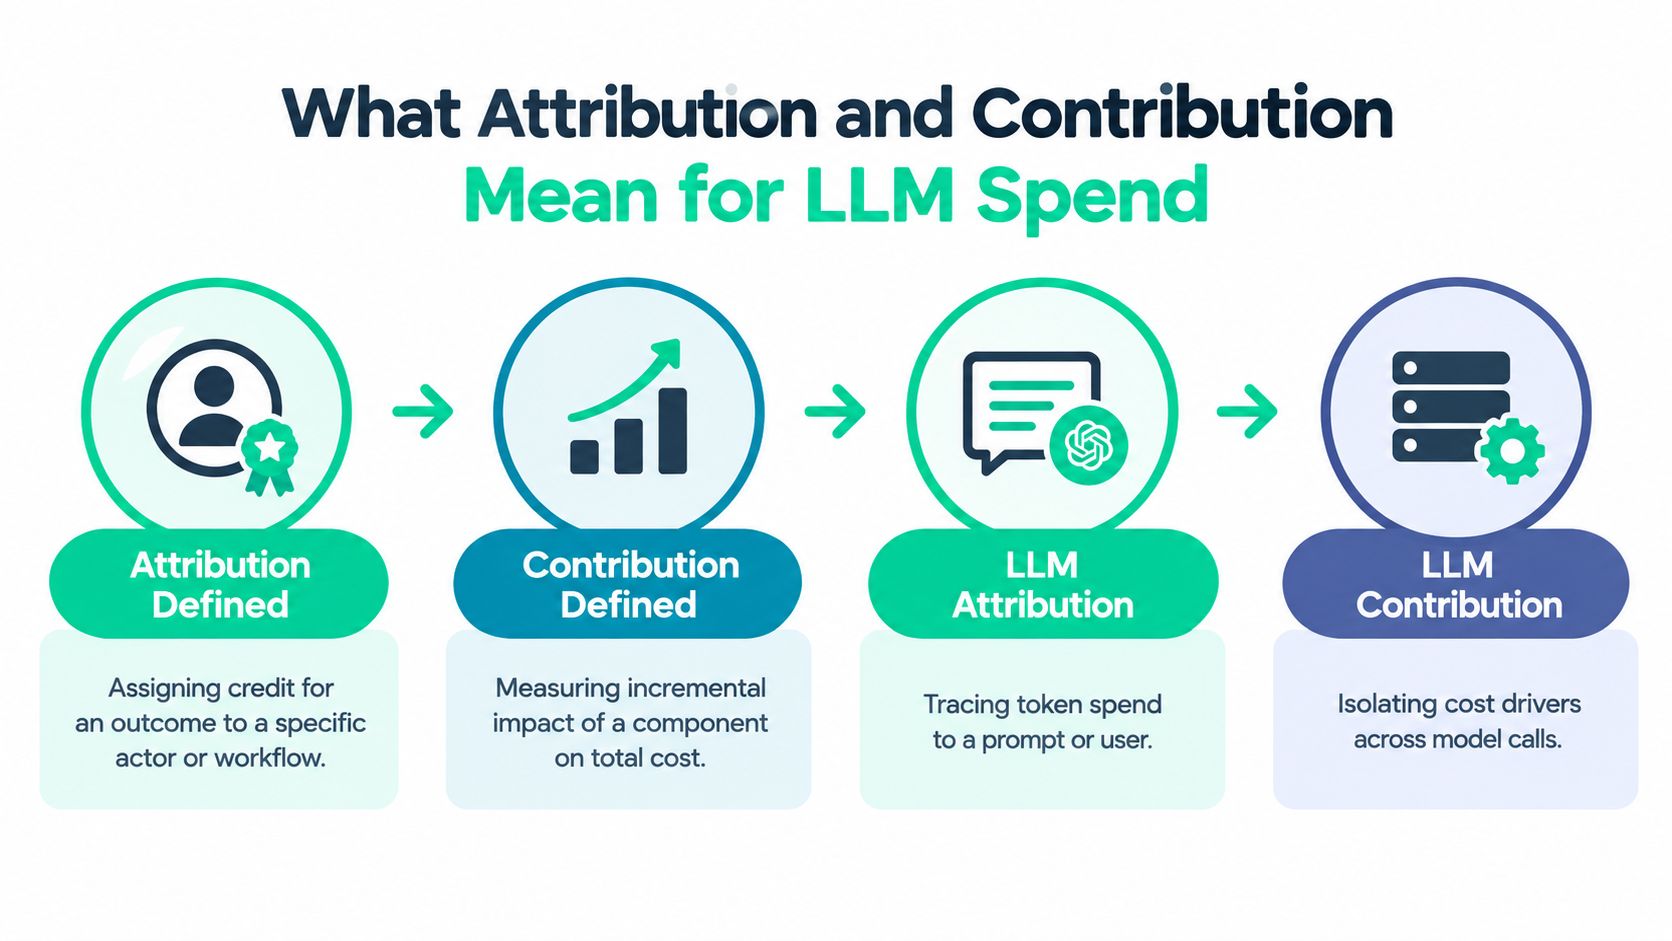
Attribution assigns credit for an outcome to a specific actor, touchpoint, intervention, or workflow. In LLM operations, that can mean linking input and output tokens to an endpoint, feature, customer workflow, experiment, or deployment. The question sounds like, “Did the new summarization endpoint cause the increase?”
Contribution measures how several meaningful inputs participate in the result. It doesn't require one factor to own the outcome. The question becomes, “How much did prompt bloat, retries, model selection, and cache behavior contribute to the recurring cost of this workload?”
The distinction is rooted in attribution theory, commonly traced to Fritz Heider and later developed by Harold Kelley and Bernard Weiner. Academic reference material describes Heider as the “father of attribution theory,” while Kelley's covariation model and Weiner's work helped establish the modern framework. In evaluation, attribution makes a stronger causal claim, while contribution uses triangulation or contribution analysis to support a plausible causal case. The reference framework on attribution versus contribution applies the same distinction directly to causal standards.
Phrase the question before instrumenting
Use an attribution question when one actor or intervention should be identifiable:
- Release diagnosis: Did the prompt change increase input tokens or retries?
- Ownership: Which feature or team generated the chargeable usage?
- Endpoint comparison: Did routing a workload to a different model change cost?
Use a contribution question when the system has overlapping drivers:
- Recurring waste: Which combination of context size, repeated instructions, retries, and model choice keeps cost high?
- Forecasting: Which workload characteristics will pressure next month's spend?
- Optimization: Which changes are likely to lower cost without harming the task?
A simple LLM example
A single endpoint starts producing more calls after a product launch. Attribution can connect the increase to that endpoint if logs show the timing, ownership, request volume, and relevant release difference. Contribution analysis can then examine whether the resulting spend came from higher volume, larger prompts, longer outputs, failed retries, or a model mix shift.
For a broader primer on allocating shared usage across business units, teams can also consult this overview of LLM cost allocation methods. The key is to avoid treating an allocation percentage as proof of causation. Allocation answers who receives the cost. Causal analysis asks why the cost changed.
How Measurement Methods Differ in Practice
Attribution usually starts with direct tagging and allocation rules. Each LLM call carries metadata such as project, team, feature, workload, endpoint, environment, or experiment. The measurement system then assigns the call's usage and price to those dimensions. If a call belongs to one workflow, that workflow can receive the recorded cost without a causal claim about every broader system driver.
Contribution analysis starts with decomposition and comparison. Analysts classify workloads, separate fixed prompt components from variable context, inspect retries and cache signals, compare model mixes, and triangulate logs with deployment history and product behavior. The output is a plausible explanation of the cost pattern, not necessarily a single owner.
Investment analytics provides a useful analogy. CFA Institute materials distinguish contribution analysis, which explains performance in isolation, from performance attribution, which explains excess return relative to a benchmark. The same framework can be applied to LLM spend: direct call costs show what generated usage, while comparison against a baseline helps explain what changed. The Openbase invoice structure overview is useful when mapping provider invoice fields to the dimensions your internal ledger needs.
Core differentiator: Attribution assigns responsibility for a defined outcome. Contribution explains the combination of conditions that produced it.
| Criterion | Attribution Approach | Contribution Approach |
|---|---|---|
| Primary question | Which actor, workflow, or intervention caused the outcome? | Which drivers meaningfully shaped the outcome? |
| Evidence | Direct logs, tags, timing, ownership, and counterfactual comparison | Theory-based analysis, decomposition, process tracing, and triangulation |
| Cost view | Per-call or per-touchpoint allocation | Workload-level and driver-level analysis |
| Best use | Chargeback, incident diagnosis, and release investigation | Efficiency, forecasting, and prioritization |
| Main risk | Over-crediting one visible touchpoint | Producing a plausible story without enough causal proof |
| Decision output | Owner, trigger, and corrective action | Driver mix, uncertainty, and optimization priorities |
Digital advertising platforms show why model choice changes the answer. Google Ads describes data-driven attribution as using account data to estimate the actual contribution of interactions across a conversion path, instead of applying fixed rule-based weights such as last click. Google Analytics also defines an attribution model as the rule set used to distribute credit, with its Attribution reports offering data-driven attribution, paid and organic last click, and Google paid channels last click. The same logic applies to LLM workflows where multiple services or touchpoints precede a billable call.
For a practical operating view of the underlying telemetry, teams can use this LLM cost tracking guide. It should help answer whether the event stream can support direct allocation before analysts attempt stronger causal claims.
Instrumentation Patterns That Enable Cost Visibility
Cost visibility starts at the application boundary. Capture business context before the provider request, allow the existing client to make the call, then ingest usage from the response. This pattern preserves provider behavior and avoids placing a routing proxy in every request path. It also supports two evidence standards: direct allocation for a bill, and driver analysis for recurring waste.
Tag the business context at the call site
A small, consistent metadata set can connect each billable call to finance and engineering records:
- Workflow:
support_reply,document_extract, orsearch_summary - Owner: team, service, or project
- Task: classification, generation, extraction, or ranking
- Feature: the product surface that initiated the request
- Environment: production, staging, evaluation, or experiment
An SDK decorator such as @spendlensai.observe can wrap a function. track() or client.tag() can attach context around calls that cross service boundaries. The syntax matters less than identifier continuity. Every downstream record should retain the same request, workflow, and ownership identifiers, so call-level attribution can roll up into contribution analysis by workload.
Keep privacy and latency constraints explicit
Metadata-only tracking can preserve workflow, model, provider, and release context without storing prompts or responses by default. Sampling prompt templates rather than full content can expose repeated instructions and oversized templates while reducing sensitive-data retention. Hashing API keys and retaining request identifiers also lets teams join usage records without turning the telemetry store into a prompt archive.
Contribution analysis requires fields that explain cost drivers, not only ownership tags. Capture cache-read and cache-write signals when providers return them, retry counts, prompt and completion tokens, model identifiers, and workload classification. Anthropic's prompt caching prices show why these fields affect analysis. A five-minute cache write costs 1.25 times the standard input price, a one-hour cache write costs 2 times, and a cache read costs 0.1 times the standard input rate, a 90% discount on repeated prompt prefixes, according to Anthropic pricing guidance summarized by Startup Fortune.
Instrumentation rule: Capture enough context to support a cost decision, while limiting content that creates unnecessary retention risk.
Dashboards should work in both directions. Project, provider, model, workflow, and owner views support attribution. Prompt waste, cache efficiency, retries, and model comparisons support contribution analysis. A guide to Snowflake observability provides a useful reference for combining usage, performance, and cost telemetry in a data platform. Teams assessing the reporting layer can also review AI spend analytics for a broader dashboard pattern.
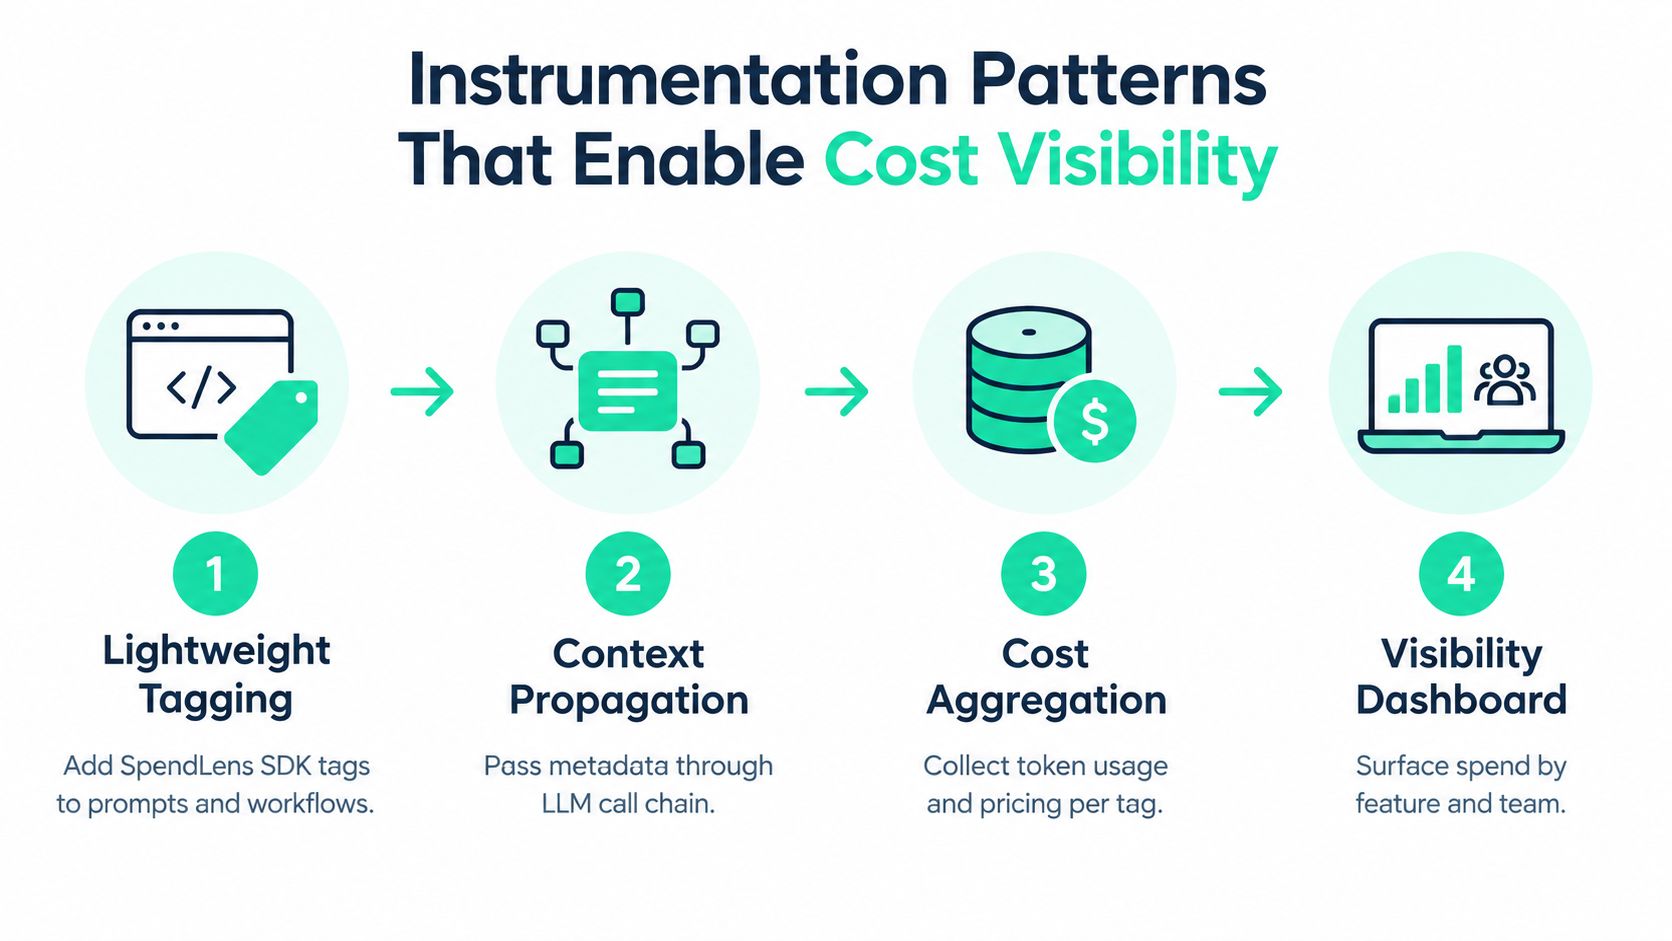
The operating flow is direct:
- Tag the call with workflow and ownership metadata.
- Propagate context through queues, workers, and downstream services.
- Aggregate usage from provider token and pricing fields.
- Compare drivers across releases, models, workloads, and environments.
A short walkthrough can make the setup concrete:
Attribution becomes the auditable base layer. Contribution then uses the same event stream to test which repeated behaviors, routing choices, or workload changes plausibly explain recurring spend.
Real World Scenarios Where Each Approach Wins
The fastest way to choose between attribution and contribution is to examine the action that follows the analysis. A team investigating an incident needs a defensible trigger. A team planning optimization needs a ranked set of drivers and a way to estimate value before making a change.

A prompt release precedes a sudden increase
Ask: Did this release cause the increase?
Use attribution first. Join deployment timestamps to workflow tags, prompt-template versions, token usage, retry events, and model selection. Compare the changed workflow with its prior behavior or a comparable unchanged workload. If the evidence points to the release, the immediate value is time saved during investigation and a precise rollback or prompt fix.
Don't claim the prompt alone caused the entire increase if traffic, retries, and routing changed simultaneously. Attribute the confirmed intervention, then use contribution analysis to explain the remaining variance.
Finance needs a monthly chargeback
Ask: Who consumed the billable usage?
Use call-level attribution. Assign each request to a team, product feature, customer workflow, or internal project, then define treatment for shared services and untagged events. The financial benefit is clearer accountability and less manual reconciliation. The engineering benefit is that teams can see the workloads behind their allocation instead of receiving an unexplained provider total.
This approach doesn't prove that the assigned team created inefficient spend. It identifies the owner of the recorded consumption.
A model switch looks promising
Ask: Which workload could move to a lower-cost model without unacceptable risk?
Use contribution analysis to identify workloads with similar task requirements, prompt shapes, output demands, and quality constraints. Compare model mix, token consumption, retry behavior, and evaluation results. Then use attribution to track the actual experiment and verify whether the migrated workflow delivered the expected reduction.
The value is a measurable decision rather than a blanket provider change. You can estimate potential monthly savings from the affected workload, record the confidence of the evidence, and include migration risk before assigning engineering time.
Repeated templates inflate recurring spend
Ask: What combination of prompt design and cache behavior makes this workload expensive?
Contribution is the stronger first lens. Inspect repeated system instructions, oversized context, long outputs, and cache-read opportunities. Anthropic-style caching provides a concrete calculation: a cache write can cost more than an ordinary input, while a cache read is priced at 0.1 times the standard input rate, as documented in the cache-aware LLM routing explanation. A team can compare uncached input tokens with cache-read tokens and prioritize workflows where the same prefix is reused.
The saved value comes from fewer billable input tokens and less investigation time. Attribution still matters afterward, because the template fix should be tied to the affected workflow and verified against its subsequent usage.
Trade Offs and How to Choose the Right Method
Attribution is not automatically more accurate, and contribution isn't a weaker version of attribution. Each method answers a different decision question and carries a different burden of evidence.
A useful decision matrix looks like this:
| Business question | Preferred method | Minimum evidence | Acceptable uncertainty |
|---|---|---|---|
| Which workflow triggered a release-related spike? | Attribution | Versioned tags, timestamps, usage logs, and a counterfactual comparison | Low, because rollback decisions are immediate |
| How should shared spend be allocated? | Attribution with explicit rules | Complete ownership metadata and documented treatment of shared calls | Moderate, if allocations are transparent |
| Why does a workload remain expensive? | Contribution | Driver decomposition and triangulation across logs and workload behavior | Higher, if actions are tested afterward |
| Which model-switch opportunity comes first? | Contribution followed by attribution | Comparable workload classes, quality evidence, and experiment tracking | Moderate, with migration risk recorded |
| What will change next month's forecast? | Contribution | Stable workload drivers and sensitivity analysis | Depends on planning horizon and business tolerance |
When a percentage of credit misleads
A percentage can look precise while hiding an assumption. If a request passed through a router, an application service, a retrieval layer, and a model endpoint, assigning all cost to the endpoint may be operationally convenient but causally incomplete. Adobe documents a related mechanic in analytics: attribution models matter when multiple dimension items appear within the lookback window, but if only one item is present, that item receives 100% credit regardless of the model. The Adobe attribution model documentation makes the allocation rule explicit.
For LLM spend, report the allocation rule beside the result. “Feature owns the call” is different from “feature caused the cost increase.”
Reconciling conflicting outputs
Attribution may identify the workflow that generated the billable calls. Contribution may show that the workflow's cost depends on shared retrieval, prompt construction, retries, and model routing. Those outputs don't conflict. They operate at different levels.
Use attribution for real-time ownership and intervention. Use contribution for strategic planning, efficiency work, and forecasting. When the two disagree, check the unit of analysis first. A per-call result and a workload-level result can both be valid.
Recommended Best Practices for FinOps and Engineering Teams
A bill spike needs a defensible owner and a causal explanation. Start with attribution for chargeback and spike detection: stable workflow, feature, owner, environment, and release tags let finance separate product growth from instrumentation gaps, while engineering can test whether a release changed spend. Apply the same taxonomy across providers and services when OpenAI and Anthropic calls share one workflow.
Use contribution analysis for efficiency and forecasting. Examine model mix, prompt size, output length, retries, cache-read activity, and workload class. Cache performance should be measured as an operating input, not treated as proof that caching caused a specific bill change. Compare reusable prompt prefixes with cache reads and writes, then verify whether the resulting token and cost changes persist.
A practical checklist:
- Tagging hygiene: Require workflow, feature, owner, environment, and release metadata.
- Workload classification: Compare like-for-like tasks rather than mixing extraction with generation.
- Cache review: Track cache reads, writes, and reusable prompt prefixes.
- Opportunity ranking: Sort changes by estimated impact, confidence, and migration risk.
- Verification: Recheck spend, tokens, retries, and task quality after every model or prompt change.
- Executive reporting: Show yesterday's spend, the top driver, and the highest-impact recommendation.
Use AI cost governance guidance to assign recurring owners, review thresholds, and verification steps instead of treating governance as a one-time invoice exercise. SpendLens AI can add SDK instrumentation, associate calls with workflows and features, show spend by provider and model, and identify cache-efficiency and model-switch opportunities without placing a proxy in the request path.
The next sprint should produce one attribution view for ownership and one contribution review for a high-cost workload. Finance receives a defensible allocation, engineering gets a testable cause map, and estimated savings can be checked against actual spend after deployment.
SpendLens AI helps teams instrument OpenAI and Anthropic workloads, assign spend to workflows, and analyze recurring LLM waste. Visit SpendLens AI to connect cost visibility with model, prompt, and cache decisions.