LLM Cost Tracking That Actually Works
Practical llm cost tracking guide covering tagging, SDK hooks, dashboards, alerts, and reports to cut spend without sacrificing quality.
The provider dashboard says you spent more than expected. Your application dashboard says traffic looks normal. The product team says nobody shipped a major AI change. Yet the invoice keeps climbing, and nobody can answer which feature, tenant, model, or prompt caused it.
That gap is the LLM cost tracking problem. A monthly invoice tells you what a provider charged, but it rarely tells you why the application generated those calls. The fix isn't another finance spreadsheet. It's instrumentation at the point where your code chooses a model, builds context, retries a request, or starts an experiment.
Table of Contents
- The Moment Your LLM Bill Stops Making Sense
- What LLM Cost Tracking Measures
- Tagging and SDK Hooks That Give Every Call a Story
- Dashboards, Alerts, and Reports That Catch Spikes Early
- Reading the Numbers to Find Real Savings
- Reconciling Tracked Spend With the Real Invoice
- Turning Tracking Into a Recurring Cost Optimization Workflow
The Moment Your LLM Bill Stops Making Sense
The incident started with a short message in the platform channel: OpenAI spend had doubled week over week. No traffic surge explained it. No obvious production deployment lined up with the increase. The billing console showed a larger total tied to a shared service account, but that was where the useful attribution ended.
The first theory blamed a prompt refactor. Someone had changed a system instruction in a summarization workflow, but the change wasn't recorded as a prompt version and nobody knew whether every environment used the same template. A background job was also retrying failed requests with a larger retrieved context. The retry path used the same API key as the interactive product surface, so its activity looked identical in the provider report.
Then a forgotten fine-tuning experiment appeared in an old branch. It was still running against a staging workload, but the calls had no experiment label and no owner. The team tried mapping provider inference IDs back to application requests. Some IDs weren't retained, some logs had expired, and the shared account made the remaining matches difficult to interpret.
The missing field wasn't “total spend.” It was the business identity of each call.
The scramble produced several plausible explanations and no defensible answer. Was the increase caused by more users, longer prompts, retries, a model change, or the experiment? The team couldn't determine which product surface was driving the bill because attribution hadn't been captured when the request was created.
That morning changed the architecture discussion. Cost visibility became a telemetry problem before it became a budgeting problem. The application already emitted logs, traces, and latency metrics at the call site. LLM spend needed to become another first-class signal, attached to the same request and workflow context.
The broader market makes this more urgent. Stanford's 2025 AI Index, using Epoch AI and Artificial Analysis data, reported that a GPT-3.5-level query fell from about $20 per million tokens in November 2022 to about $0.07 per million tokens by October 2024, a reduction of more than 280x in roughly 18 months, as summarized by the AI inference cost analysis. With prices moving that quickly, an apparently small change in context, routing, or model selection can create a meaningful dollar swing without an obvious quality regression.
What LLM Cost Tracking Measures
A useful cost record starts with the provider response, not with a dashboard total. At request level, the accounting is:
Request cost = (input tokens × input rate) + (output tokens × output rate).
That equation becomes unreliable when telemetry loses the components behind it. Providers quote rates per million tokens, response payloads expose different usage fields, and cached input may have a separate rate from uncached input. Store each component separately so engineers can explain a bill rather than only observe it.
Capture provider-reported counts whenever they are available, calculate cost from a versioned pricing table, and persist both beside the request. Client-side token estimates provide fast feedback during development and can support latency-sensitive checks, but server-side provider counts should remain the accounting reference. Statsig's token usage tracking guidance recommends estimating tokens in the client, recording authoritative counts server-side, and reconciling the difference routinely.
The attribution fields that survive production
Use one stable event schema across providers and services. A practical minimum includes:
request_id,timestamp, andenvironmentidentify the event and its operating context.tenant_idanduser_idsupport customer chargeback, abuse investigation, and pricing analysis.feature,workflow_id, andteamconnect spend to a product decision and its owner.modelandprovidershow whether a cost change came from routing or usage.prompt_versionandexperiment_armmake prompt and model tests comparable.input_tokens,cached_input_tokens,uncached_input_tokens,output_tokens, andtotal_costpreserve the inputs used for billing.cache_hit,retry_count, andstatusexpose failed paths and avoidable spend.
One event can serve several accounting views. Request-level cost helps an engineer inspect an expensive trace. Feature-level rollups show whether search summarization or support drafting consumes the budget. Tenant-level views support showback or chargeback without asking finance to reconstruct usage from a shared API key.
| Token Component | Unit | Why It Matters |
|---|---|---|
| Uncached input | Tokens | Usually uses the base input rate and can include system instructions, retrieved context, and conversation history |
| Cached input | Tokens | May receive a substantial discount, so combining it with uncached input hides cache performance |
| Output | Tokens | Often has a different rate and grows with verbosity, reasoning, tool results, or missing output limits |
| Total tokens | Tokens | Useful for capacity and context analysis, but insufficient for accurate cost calculation alone |
Model attribution matters because pricing varies widely across tiers. A 2026 industry analysis places commodity pricing around $0.10 to $0.40 per million tokens and frontier reasoning pricing around roughly $30 to $60 per million tokens, a spread of well over 100x (the 2022 to 2026 inference cost trajectory). Public examples include Gemini 2.5 Flash at about $0.30 input and $2.50 output per million tokens, GPT-4.1 Nano at about $0.10 input and $0.40 output, and GPT-5.4 Pro at about $30 input and $60 output.
Keep tool-call overhead, reasoning-model usage fields, batch discounts, fine-tuned model rates, and provider-specific rounding in configuration. Otherwise, a dashboard can report costs with impressive precision while still producing the wrong total.
Tagging and SDK Hooks That Give Every Call a Story
Tags should be assigned where the product code makes the decision, not inferred later from a log message. A router knows that a request belongs to ticket_classification; a retry handler knows that it is a retry; an experiment runner knows which arm is active. Those values are reliable at the call site and ambiguous after the fact.
Start with a provider-neutral object:
metadata = {
    "tenant_id": tenant_id,
    "feature": "ticket_classification",
    "team": "support-ai",
    "environment": "production",
    "model": "gpt-4.1-nano",
    "prompt_version": "classifier-v3",
    "experiment_arm": "nano-route",
    "workflow_id": workflow_id,
}
Wrap the provider client once. The wrapper should start a span, attach metadata, call the provider, read the response usage fields, calculate cost from the current pricing configuration, and emit one structured event.
@observe_llm
def classify_ticket(messages, metadata):
    response = openai_client.chat.completions.create(
        model=metadata["model"],
        messages=messages,
    )

    usage = response.usage
    event = {
        "request_id": current_request_id(),
        **metadata,
        "input_tokens": usage.prompt_tokens,
        "output_tokens": usage.completion_tokens,
        "total_cost": pricing.cost(
            model=metadata["model"],
            input_tokens=usage.prompt_tokens,
            output_tokens=usage.completion_tokens,
        ),
        "status": "ok",
    }
    telemetry.emit("llm.request.cost", event)
    return response
A Python decorator works well for application services because it standardizes instrumentation without forcing every caller to remember a logging sequence. In Node, middleware can place the metadata object in request context, wrap the provider call, and emit the event in a finally path so errors and retries remain visible.
Propagation matters more than the wrapper
Async fan-out is a common source of attribution loss. If one request launches retrieval, classification, and response generation concurrently, each child call must inherit the parent workflow_id, tenant, feature, and experiment arm. Retry attempts should retain the same logical request identity while adding an attempt_id or incrementing retry_count.
Provider-specific headers or user fields can carry correlation data where supported, but your internal event remains the source of truth. Keep prompts and responses out of telemetry by default when metadata-only tracking is sufficient. A useful implementation reference for connecting this event model to traces is the SpendLens AI OpenTelemetry documentation.
Instrumentation rule: If a tag requires someone to remember to add a log line, it will eventually disappear on the most expensive path.
Dashboards, Alerts, and Reports That Catch Spikes Early
A useful dashboard doesn't try to display every field. It answers four operational questions quickly: which service is spending, which model is responsible, whether request shape changed, and whether the system is failing or missing cache opportunities.
Build the first view around:
- Hourly cost by service and model, grouped by team and feature tags.
- P50 and P95 input and output tokens per request, so prompt growth and long generations stand apart.
- Cache hit rate by route and prompt version, rather than one global cache number.
- Error and retry rate, because failed calls can create additional spend without producing user value.
Record cost in middleware after the provider response arrives, then export counters and histograms to Prometheus or an equivalent metrics backend. Grafana can aggregate the raw events into panels, but retain the underlying request records for investigation. A bar showing higher model spend tells you where to look. The trace tells you which release or prompt version changed.
The supplied visualization context describes a dashboard with hourly model costs, P50 and P95 token counts, cache hit rate, and error rate broken down by team tag. Treat those panels as a compact operating surface, not a finance report. The exact values displayed in a mock visualization aren't production measurements, so your panels should query your own telemetry.
Alert on ownership and change
A 2x spike in hourly cost per feature tag is actionable when it routes to the team that owns that feature. A cache-hit alert should compare the current route against its defined baseline, because a global threshold can create noise across workloads with different prompt shapes.
Don't page finance for an engineering regression. Send a model or feature anomaly to the owning team, create a ticket with the relevant deployment and prompt version, and reserve finance reporting for reconciled totals.
A weekly report can export request and rollup data to finance as CSV, with a PDF summary tied to Jira epics. The report should include owner, feature, model, environment, spend, token mix, cache efficiency, and open investigations. Guidance on detecting actionable spend anomalies is also available in SpendLens AI's cost anomaly detection guide.
Reading the Numbers to Find Real Savings
A total bill cannot tell you what to change. Break it into usage volume, input shape, output shape, cache behavior, and model mix, then connect each movement to a route, prompt version, deployment, or owner. Cost tracking becomes useful when every savings claim can be tested against request-level telemetry.
Caching shows why this detail matters. OpenAI charges cached input at 0.1 times the uncached input-token rate, while cache writes cost 1.25 times the uncached input-token rate (OpenAI's prompt caching documentation). Anthropic documents cache writes at 25% above base input pricing for a 5-minute time-to-live and 2 times the base input price for a 1-hour time-to-live. Cache hits cost 0.1 times the base input price (Anthropic's prompt caching documentation).
A route with repeated system instructions, tool schemas, or stable retrieved context can therefore save money as its hit rate improves. Instrument cache status, cached input, uncached input, prompt version, and route together. Then measure the cost delta per request, rather than reporting a projected percentage without a baseline.
Model routing creates a separate pattern. A classification route may be using a frontier model even though a smaller model meets its quality requirement. Treat that as a model-mix issue, test the alternative behind an experiment arm, and compare cost per accepted outcome. Provider rates, token shape, and quality constraints determine the result, so cost per request alone is not enough.
Prompt bloat looks different. Input tokens rise while request volume remains stable, often after retrieval expansion, conversation-history growth, or a template change. Compare prompt versions directly, identify the changed token components, and calculate avoided input cost from the tracked delta.
| Variable | Dashboard Signal | Pricing Example | Typical Move |
|---|---|---|---|
| Cache efficiency | Cached input rises while uncached input falls on repeat routes | OpenAI cached input uses 0.1 times the uncached input rate | Stabilize repeated prefixes and inspect cache boundaries |
| Model mix | Expensive-model share grows for simple workflows | Model prices can vary widely across tiers | Route classification, extraction, or formatting to an evaluated lower-cost model |
| Prompt shape | Input tokens increase without matching product activity | Long repeated prefixes may qualify for provider caching | Remove redundant instructions, cap retrieved context, and version templates |
| Output behavior | Output tokens or tail costs rise | Output rates differ from input rates by model | Add task-specific output limits and inspect verbose paths |
Run each proposed change with a recorded baseline, treatment, quality result, and request population. The LLM cost savings calculation guide can help structure that comparison, while reconciled telemetry provides the result you can trust.
Reconciling Tracked Spend With the Real Invoice
A dashboard estimate becomes trustworthy only when it can survive an invoice comparison. Run reconciliation monthly, and don't wait for a discrepancy to become a budget dispute.
Export three datasets for the same billing window:
- Cost telemetry, grouped by provider, model, day, environment, and feature.
- Gateway or proxy totals, grouped by provider and model for the same dates.
- Provider invoice line items, including credits, discounts, cached-token charges, batch treatment, and fine-tuned model entries where applicable.
Join the first two on provider, model, and day. Then compare the combined totals with the invoice's corresponding line items. The purpose isn't to force every layer to match immediately. It's to identify where the first divergence appears.
Investigate the usual gaps
Telemetry can miss a request that fails before tagging or event emission occurs. A gateway can double-count streamed chunks if it treats each chunk as a complete response. The provider can apply rounding, credits, discounts, or pricing rules that your local table doesn't yet model.
Track each variance as a reason code:
- Untagged request, the application created traffic outside the wrapper.
- Retry mismatch, one layer counted logical requests while another counted attempts.
- Streaming aggregation, chunks were summed incorrectly.
- Pricing version, the local rate table was stale.
- Invoice adjustment, credits or provider corrections weren't represented in event data.
Recent guidance identifies pricing changes, cached-token fields, batch discounts, and stale fine-tuned model pricing as recurring tracking gaps, and recommends reconciliation across observability, gateway, and invoice totals (Braintrust's LLM cost tracking guidance).
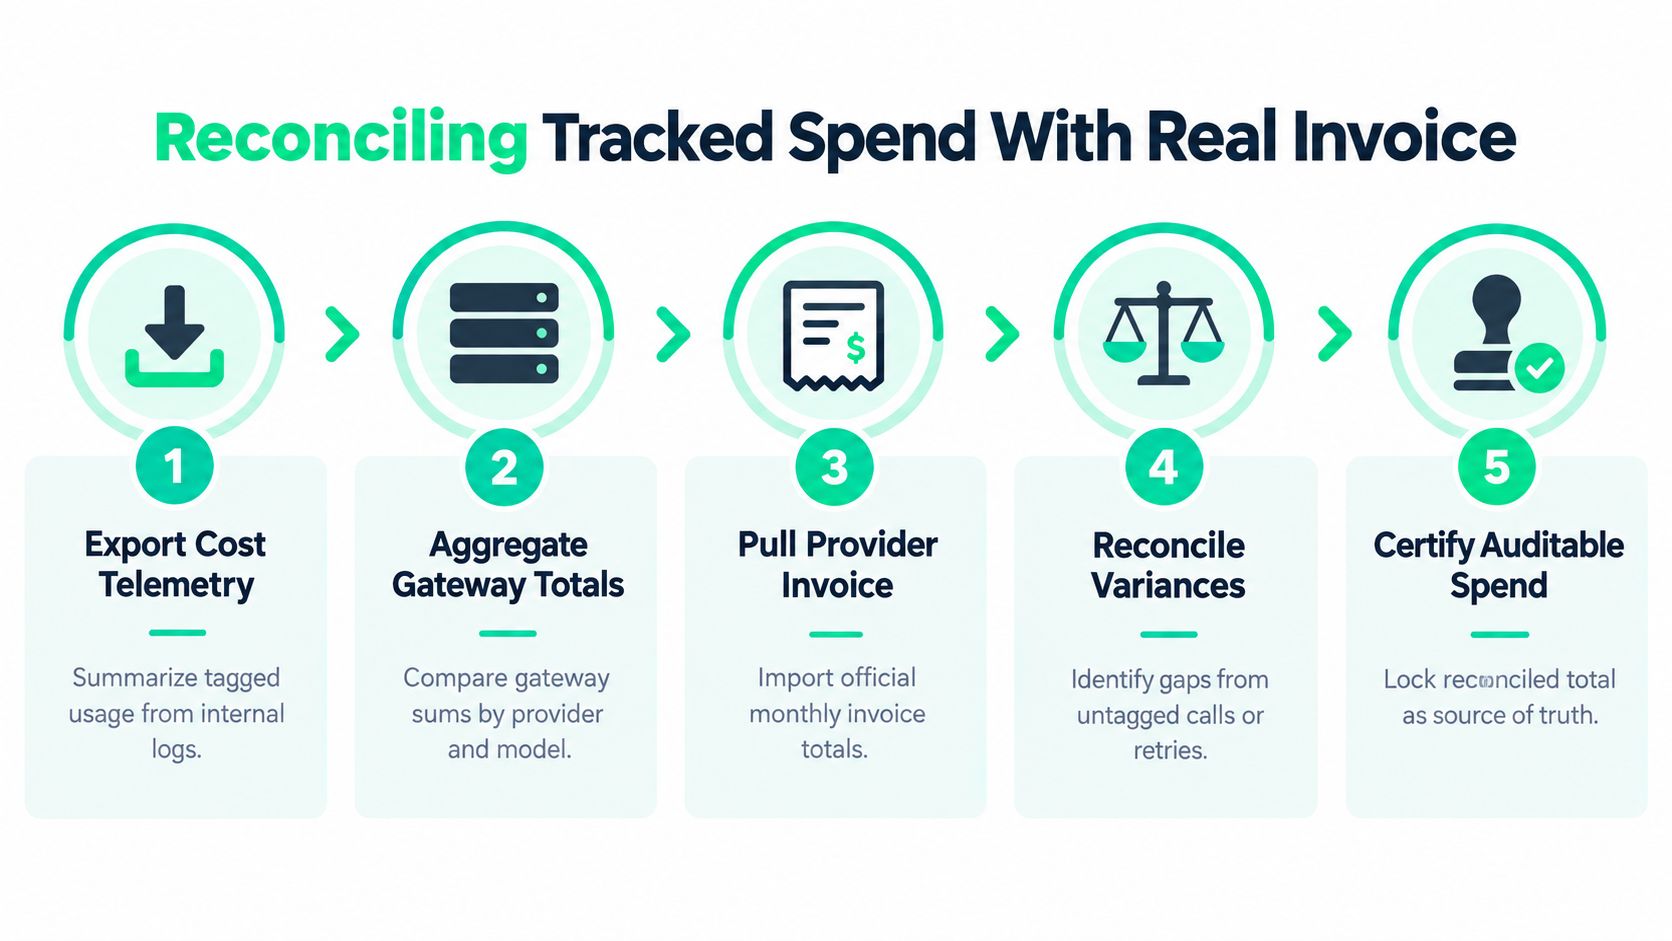
Set a close rule before the first monthly review. For example, require tracking-to-invoice variance under 2% before finance closes the period, and assign an owner to explain anything larger. That tolerance is an operating policy, not a universal provider rule, so adjust it to your accounting needs while preserving the essential behavior: every unexplained difference gets a named owner and a documented cause.
Turning Tracking Into a Recurring Cost Optimization Workflow
Instrumentation pays for itself only when somebody uses it to change decisions. The operating cadence should turn request events into a short list of experiments, then turn experiment results into reconciled savings.
Monday review
Keep the meeting narrow. Pull the top three cost drivers by feature and environment, compare them with the prior week, and assign an investigation ticket to the team that owns each tag. Each ticket should include the model, prompt version, experiment arm, token mix, retry behavior, and the proposed next test.
One driver might be a support workflow whose context grew after a retrieval change. Another might be a staging experiment accidentally using a frontier model. A third might be a background retry path that isn't visible in the product dashboard. The point is to move from “spend is high” to “this tagged path changed, this owner will test this intervention.”
Monthly experiments
Ask each team to file two measurable experiments:
- Model-routing experiment: move a defined workload to a lower-cost model, retain the original arm as a quality comparison, and measure accepted outcomes alongside cost.
- Prompt or caching experiment: reduce redundant context, stabilize repeated prefixes, or adjust cache boundaries, then compare cached input, uncached input, and output behavior.
Record predicted dollar impact in the same taxonomy as actual spend. If the experiment has no feature tag, baseline, or outcome field, it isn't ready to run.
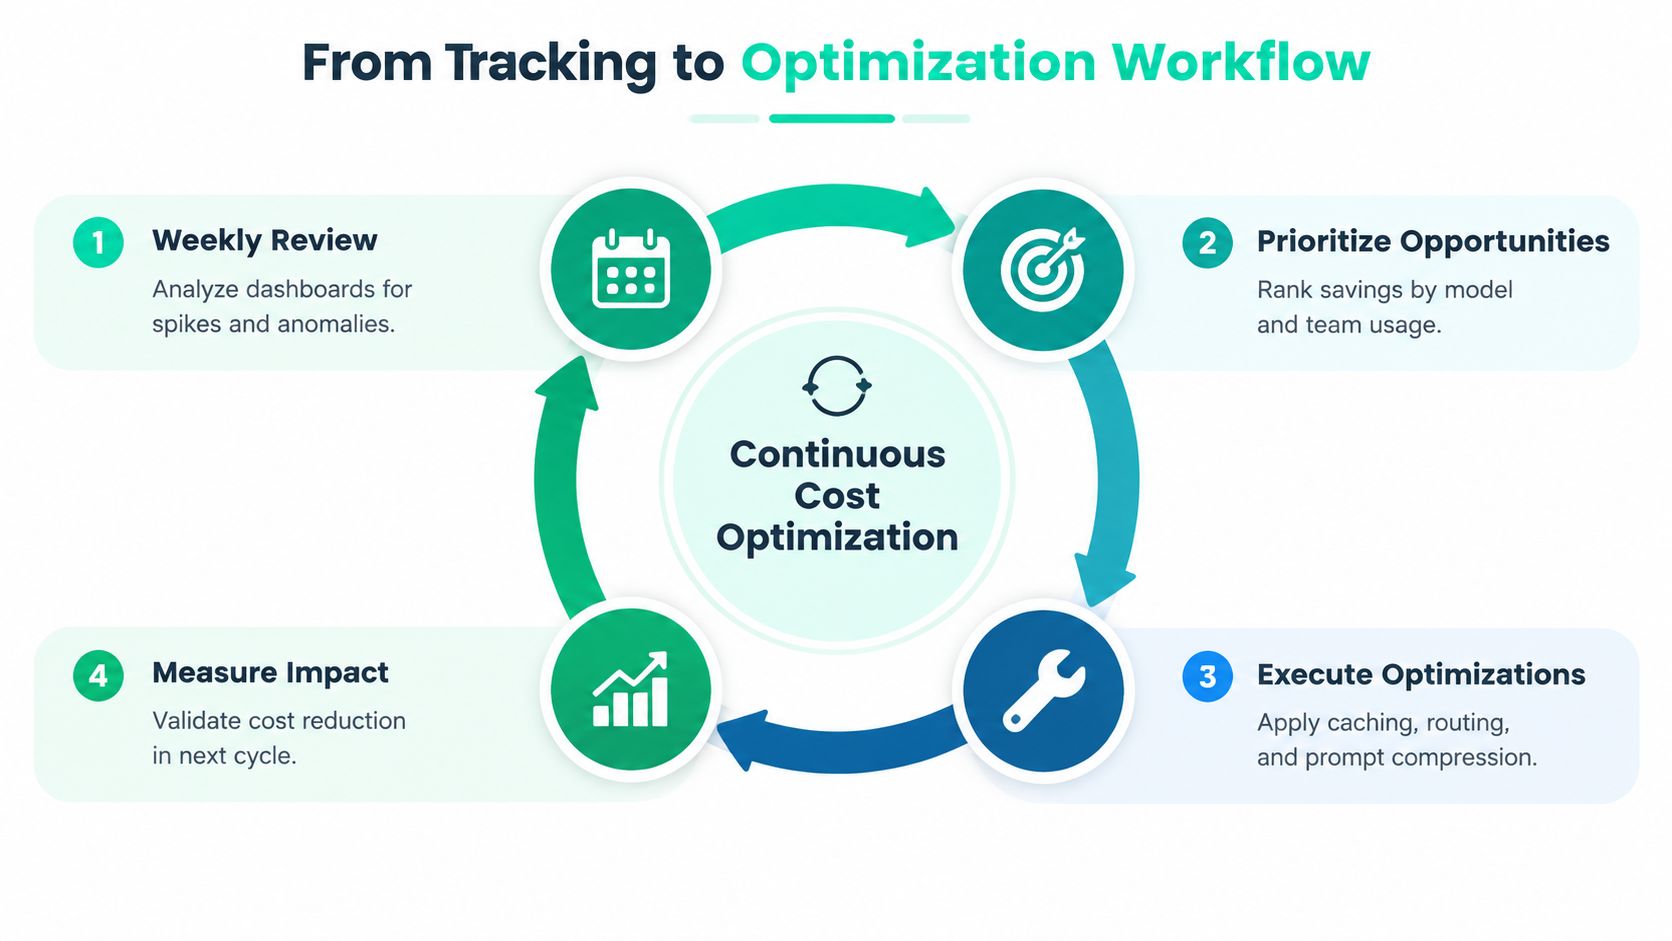
Maintain a shared backlog and a published savings log. The log should show the intervention, affected workload, baseline period, treatment period, quality check, tracked cost delta, and invoice-reconciled result. A quarterly retrospective can then review whether alert thresholds still match current traffic, whether new providers require pricing fields, and whether teams are measuring business outcomes rather than token totals alone.
Per-token metrics remain necessary, but they don't answer whether a feature earns its spend. Recent industry guidance recommends tagging calls with feature, user, and outcome data so teams can evaluate cost per outcome, while also warning that non-LLM infrastructure can exceed token spend in some production environments (FutureAGI's 2026 LLM spend analysis).
For teams comparing implementation options, AI FinOps guidance can help frame ownership, showback, governance, and optimization as one operating loop. SpendLens AI is one option that adds lightweight metadata instrumentation to OpenAI and Anthropic workloads, then surfaces spend by project, provider, model, and workload without proxying model traffic.
Every optimization must be measurable through the existing event schema. Every reported saving must reconcile to a tracked cost delta, and eventually to the provider invoice. That discipline is what turns LLM cost tracking from a dashboard project into recurring value, including engineering time saved during investigations and money saved through verified routing, caching, and prompt changes.
Start by wrapping one production workflow, adding stable tags, and comparing its request telemetry with the next provider invoice. Then visit SpendLens AI to evaluate its developer-first tracking, workload breakdowns, cache-efficiency signals, and savings recommendations for your OpenAI and Anthropic services.