AI Spend Analytics: Cut LLM Costs with Confidence
AI spend analytics explained: metrics that matter, instrumentation patterns, common pitfalls, and proven savings examples for OpenAI and Anthropic workloads.
Enterprise generative AI spend rose from $11.5 billion in 2024 to $37 billion in 2025, a 3.2x increase, even as per-token costs fell sharply, according to Menlo Ventures data cited in enterprise AI spending coverage. That contradiction defines the AI cost problem. Cheaper tokens don't guarantee cheaper products when teams add more users, longer contexts, model upgrades, and autonomous workflows.
AI spend analytics turns that problem into an operating model. It connects each inference call to the product, feature, tenant, model, and outcome responsible for the charge. With that evidence, engineering can optimize usage without guessing, product can price AI features around contribution margin, and finance can forecast AI as a portfolio expense rather than reconcile a confusing provider invoice after the fact.
Table of Contents
- Why AI Spend Analytics Matters More Than Model Prices
- What AI Spend Analytics Measures
- Attribution, Tagging, and the Cost of Invisible Calls
- Instrumentation Patterns That Stay Out of the Request Path
- Caching, Prompt Trimming, and Real Savings Examples
- Choosing a Tooling Pattern Without Adding Latency
- From Per-Call Cost to Portfolio Forecasting
- Your First 30 Days With AI Spend Analytics
Why AI Spend Analytics Matters More Than Model Prices
The common assumption is simple: model prices fall, so AI bills should fall too. That logic breaks when demand expands faster than unit prices contract. Independent reporting describes enterprise AI inference spending growing 3.2x in 2025, while per-token costs fell by a factor of 1,000. The same analysis identifies a split between inexpensive commodity inference and costly frontier reasoning workloads, which means model selection alone can't explain the bill. Axe Compute's analysis of inference costs at scale captures the underlying issue: usage, context length, and workflow complexity can overwhelm cheaper tokens.
The scale of the market makes this a finance problem, not only an engineering problem. Global AI spending is projected to reach $2.59 trillion in 2026, a 47% increase over 2025, and more than 45% of that spending is expected to go toward infrastructure such as servers, chips, and compute, according to Gartner-linked industry coverage. Data-center spending is also expected to surpass $788 billion in 2026, showing why teams must track infrastructure exposure as well as downstream model usage.
The misleading price-only comparison
The table below shows why the requested comparison needs a qualification. The verified data supports the direction of token-price compression and the scale of spend growth, but it doesn't provide comparable flagship-model prices for 2023 and 2025. A responsible analytics program should never fill that gap with an assumed price.
| Metric | 2023 | 2025 | Change |
|---|---|---|---|
| Flagship-model input price | Not provided in verified data | Not provided in verified data | Industry reporting describes a substantial decline, but no verified percentage is available here |
| Enterprise generative AI spend | Not provided in verified data | $37 billion | Increased from $11.5 billion in 2024 to $37 billion in 2025, 3.2x |
| Worldwide GenAI spending | Not provided in verified data | $644 billion projected | 76.4% increase from 2024, according to Gartner's forecast |
The practical definition is sharper than “a dashboard of AI bills.” AI spend analytics attributes every call to a business owner, converts usage into per-transaction cost, and connects that cost to gross margin or a measurable outcome. For example, a support feature might look inexpensive per request but unprofitable per resolved ticket if it makes several hidden retrieval, classification, and reasoning calls.
Teams building this discipline can use AI spend management guidance as a reference point. The objective isn't to chase the cheapest model. It's to know which workload is growing, who benefits, what each successful outcome costs, and whether that cost remains defensible as usage scales.
What AI Spend Analytics Measures
AI spend analytics records the economics of each LLM interaction, then connects usage to portfolio-level unit economics. A useful event includes input and output tokens, model, region, latency, cache behavior, feature, tenant, and outcome. With those fields, a product manager can answer a provider invoice's missing question: What did this feature cost per user, session, conversation, or completed task?
Falling per-token prices do not guarantee lower total spend. Volume, longer prompts, multi-step workflows, retries, and growing adoption can outweigh cheaper inference. Measurement therefore starts with consistent definitions across providers and five baseline metrics.
Five baseline metrics
Tokens in and out. Record input and output separately. Billing follows token volume rather than call count, so a short classification request and a long reasoning response require different cost assumptions. Amnic's cost-allocation guidance recommends capturing both token types on every API call.
Cost per call by model and region. Use provider billing data or a controlled pricing table, while preserving model tier and region as dimensions. A blended average can conceal an expensive reasoning path inside an otherwise low-cost workload.
Cache hit rate. Record whether repeated context was treated as a cache read. This separates new input from repeated prompts that continue consuming spend.
Cost per successful task outcome. Divide inference cost by a defined success event, such as a valid extraction, resolved ticket, accepted draft, or completed workflow. Low call cost has limited value if users need retries or human rework.
Cost per active user or session. This denominator links infrastructure consumption to adoption. Rising spend may reflect healthy growth when successful outcomes grow with it. Stable spend can become less attractive if engagement declines.
Why the denominator matters
A workflow with one expensive call may outperform another with several cheap calls if it succeeds more often and requires less rework. Cost per call alone would reverse that conclusion. Cost per successful outcome exposes the unit economics that portfolio forecasts need.
Finance and engineering can use a practical guide to aligning finance and engineering on AI cost metrics to establish shared terminology. Maintain a consistent AI spending tracker with raw events, allocated costs, and outcome metrics. Monthly totals show what was spent. These dimensions explain why the bill rose and whether the resulting growth supports the product portfolio.
Attribution, Tagging, and the Cost of Invisible Calls
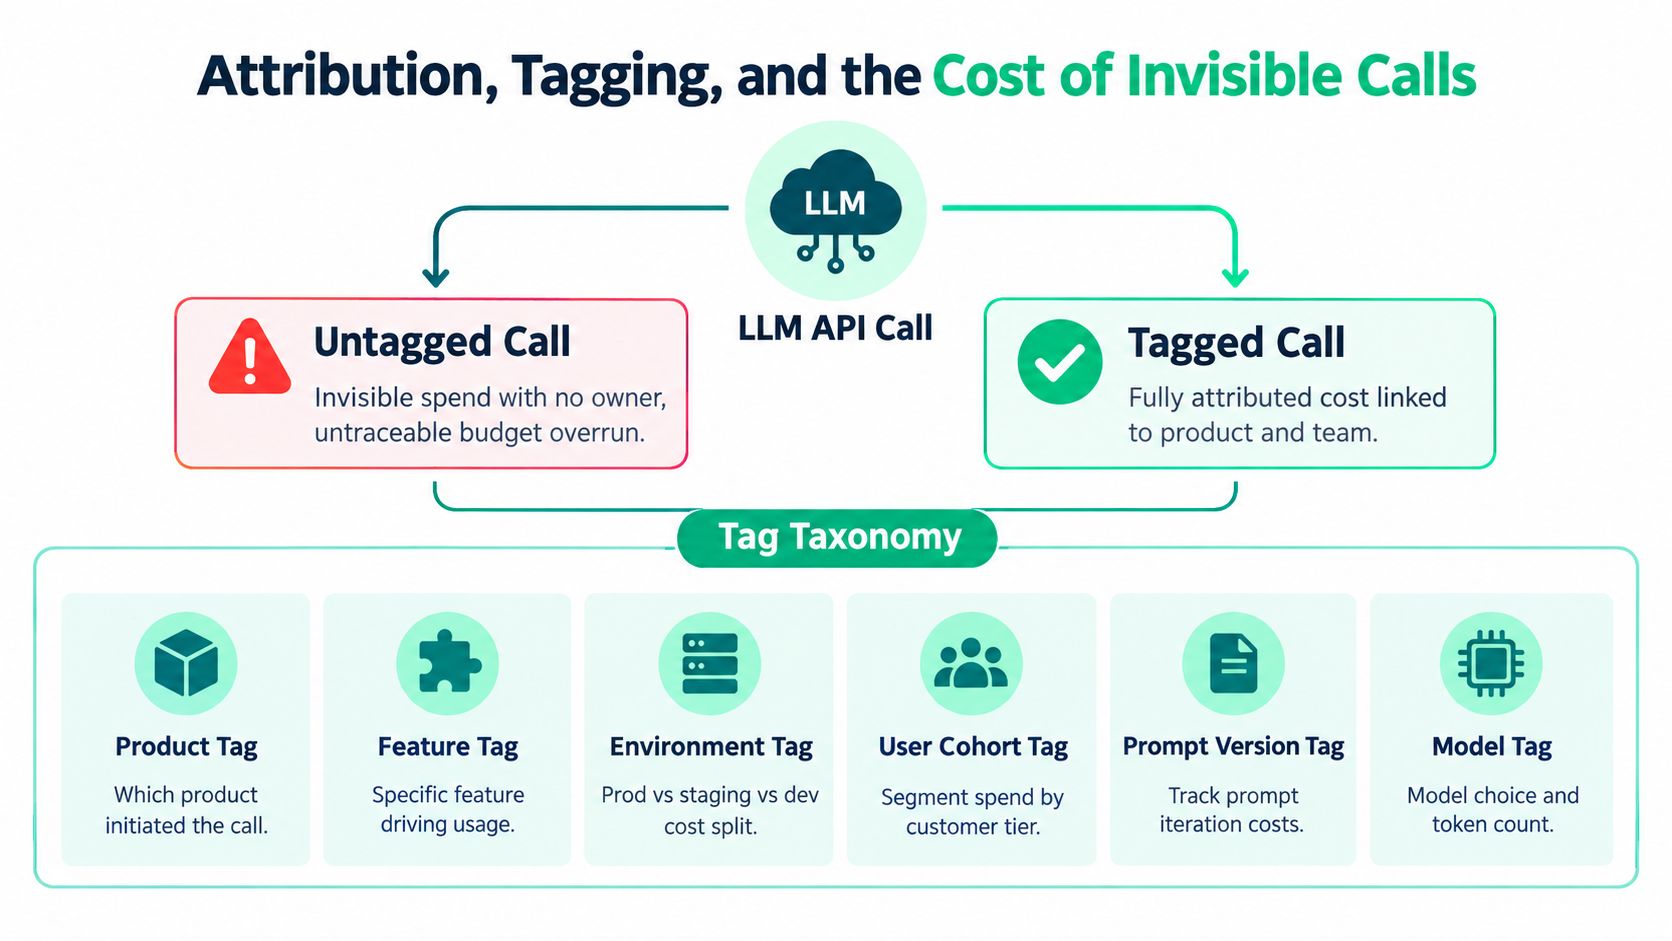
An LLM invoice tells you what the provider charged. It doesn't automatically tell you which feature caused the usage, which customer benefited, or whether a background job multiplied the bill. The remedy is to stamp every inference event with enough metadata to reconstruct ownership later.
The minimum taxonomy should include product, feature, environment, user cohort, prompt version, model, tenant, and request ID. Add provider, model version, workflow, endpoint, and cache status when those fields affect decisions. A tenant identifier supports customer-level economics, while a prompt version exposes cost changes after a template update.
Reconcile three records
Use one source-of-truth table for call-level events, then reconcile it against three systems:
- Gateway telemetry: Count calls and tokens at the point where your application sends requests.
- SDK or application logs: Capture calls made through wrappers, background workers, and third-party libraries that may bypass a central gateway.
- Provider invoices: Compare the recorded token totals and charges with the billed totals, preserving a variance field for investigation.
The reconciliation process should run daily. Log sampling helps identify untagged paths without storing sensitive prompts, while variance checks flag providers or services whose billed usage doesn't match internal telemetry. The FinOps AI project playbook recommends tagging each inference call with feature, user or tenant, prompt-template ID, and model. It also recommends measuring spend-weighted attribution coverage, meaning the share of AI dollars assigned to an owner.
You can't optimize what you can't assign. An untracked scheduled job might consume more than a visible product feature, but its cost won't appear in a team review until the invoice arrives. High attribution coverage therefore isn't administrative hygiene. It is the condition that makes savings, chargeback, and product-margin analysis possible. Teams extending this setup can use LLM cost tracking practices to structure the event model and reconciliation workflow.
Instrumentation Patterns That Stay Out of the Request Path
Instrumentation should observe the request without becoming part of the request's critical path. A Python decorator is a practical boundary because it can wrap OpenAI or Anthropic client calls, collect telemetry, and return the provider response without forcing application teams to rewrite business logic.
The wrapper should capture latency, input tokens, output tokens, provider, model, model version, prompt hash, feature flag, tenant, environment, prompt template ID, and cache-hit status where available. It should emit an event to an asynchronous queue, background thread, or message bus. The user-facing request should not wait for a pricing lookup, warehouse write, or analytics API response.
A metadata contract for every call
| Field | Purpose | Example |
|---|---|---|
| Feature | Connects spend to a product capability | ticket_summary |
| Environment | Separates production from non-production usage | production |
| Tenant | Supports customer-level allocation | tenant_482 |
| Model version | Explains model substitutions and behavior changes | provider_model_release |
| Prompt template ID | Tracks template revisions | summary_prompt_v4 |
| Cache hit flag | Identifies repeated context savings | true |
| Request ID | Joins retries and downstream events | req_abc123 |
A prompt hash can support grouping without storing the prompt itself. That approach is useful when privacy requirements prohibit retaining user content. Store only the metadata required for cost attribution by default, then sample template text under controlled access when engineers need to investigate token waste.
Avoid synchronous pricing lookups
Synchronous cost calculation creates a fragile dependency. If the pricing service slows down, a user request can inherit that delay. Calculate cost after the event lands by joining token usage to a versioned price table. This also lets finance reproduce historical reports when provider prices or model names change.
For teams standardizing traces across services, OpenTelemetry guidance for LLM observability provides a useful conceptual model. The important design choice is separation: provider calls remain direct, telemetry writes happen asynchronously, and the warehouse becomes the place where cost, attribution, and outcome data meet.
Caching, Prompt Trimming, and Real Savings Examples
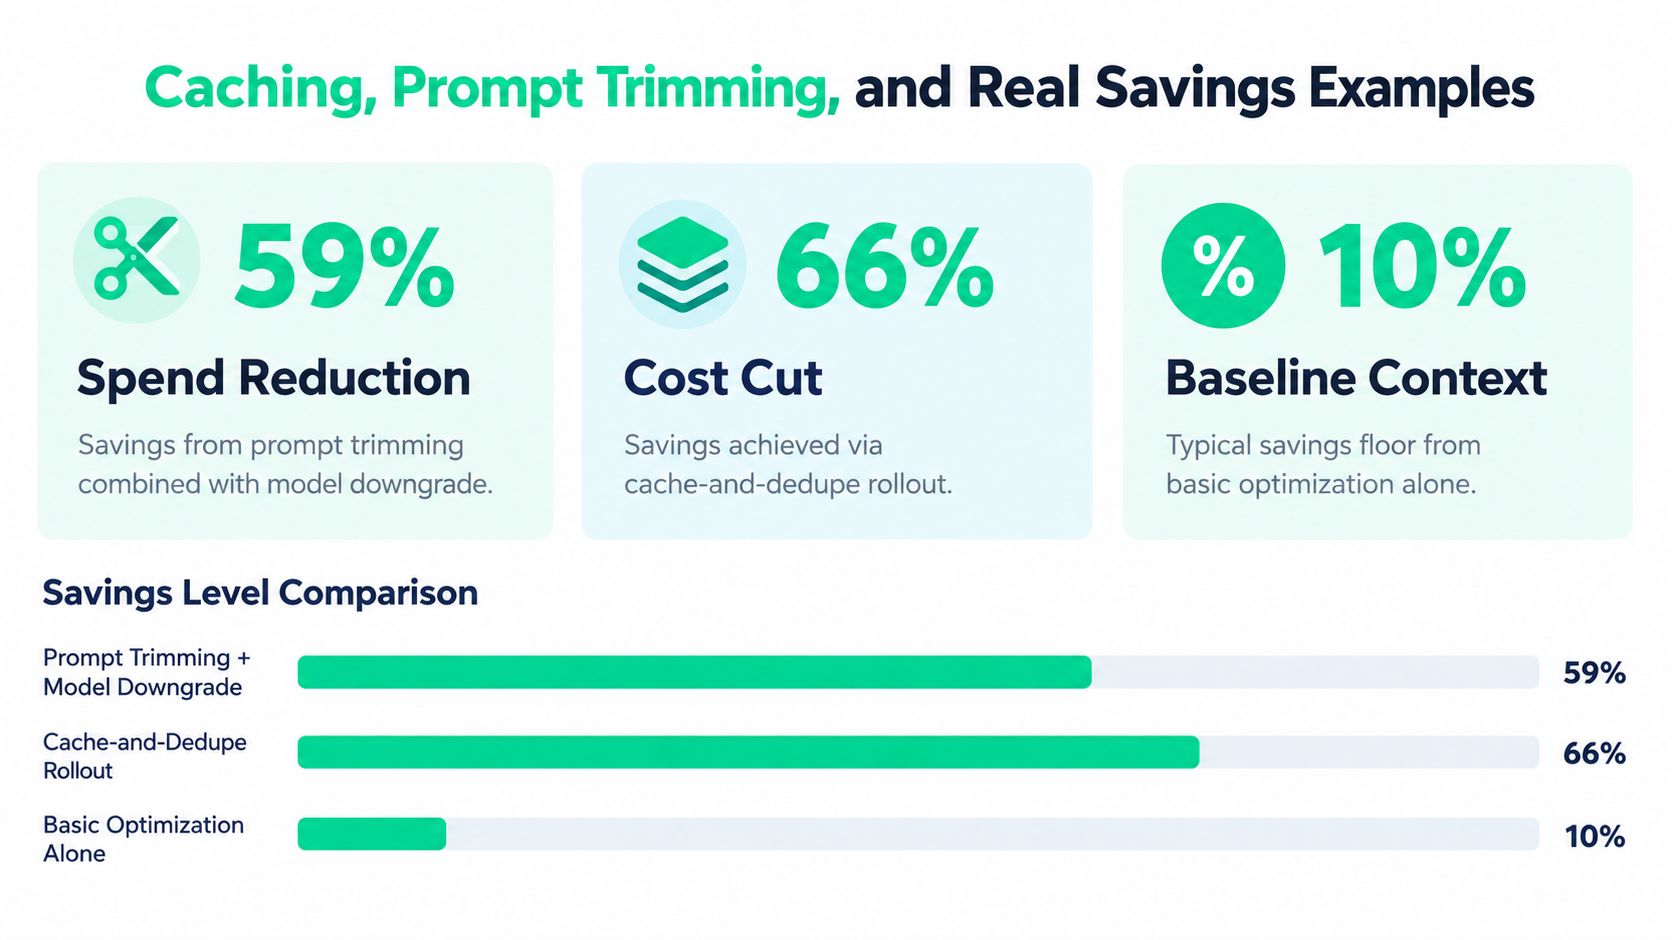
The clearest savings usually come from eliminating repeated work. Anthropic prices cached reads at 10% of the standard input rate, and one analysis places the break-even point at the second cache hit. Stable prompt prefixes can be cached for 5 minutes at 1.25x the normal input price or 1 hour at 2x, then reused at 0.10x during the time-to-live, according to this analysis of caching, routing, and token waste.
Prompt trimming produces a separate, inspectable saving. A prompt containing 1,200 input tokens, including 400 tokens of repeated system context, falls to 800 tokens after that context is removed. Input volume drops by one-third, so the input portion of each call costs one-third less when other pricing conditions stay constant. Engineers can compare the old and new prompts, then check whether task quality changed. That evidence is stronger than choosing a cheaper model based only on intuition.
Match the cache to the workload
Exact-match caching fits repeated requests or stable context, including classification, extraction, recurring agent instructions, and fixed system prompts. Semantic caching can suit support bots when equivalent questions should receive equivalent answers. It is less reliable for code tools, where small input changes may require different output.
A workload with 500,000 daily calls and a 10% hit rate would generate 50,000 cache hits per day, assuming one eligible repeated unit per call. The resulting dollar value depends on token volume, provider, model, and cache pricing. Forecasts should therefore use observed cached tokens, rather than promise a generic monthly saving.
Portfolio analysis matters here. A lower per-call rate can coexist with a higher AI bill if request volume, context size, or the number of production workflows grows. Track cost per successful task and cost by workload, not only aggregate provider spend. Those measures show whether caching and trimming improve unit economics or merely support more consumption.
A reported production example found prompt caching reduced overall LLM costs by 59% against an uncached baseline and by 66% after subsequent optimization. The savings remained tied to token volume that would otherwise have incurred full input charges, as documented by ProjectDiscovery's caching case.
For teams revising templates, prompt optimization guidance complements token-level measurement. Identify repeated context, test trimming, measure cache eligibility, and evaluate cost per successful task. Consider model substitution only after those results establish where the portfolio's unit costs are rising.
Choosing a Tooling Pattern Without Adding Latency
Instrumentation isn't a single product decision. It is a sequence of trade-offs involving latency, coverage, engineering effort, and governance. The best starting point for a high-throughput service may not be the right architecture once the company needs routing, rate limits, replay, or provider failover.
Compare the three patterns
| Pattern | Latency overhead | Attribution accuracy | Vendor lock-in | Engineering effort |
|---|---|---|---|---|
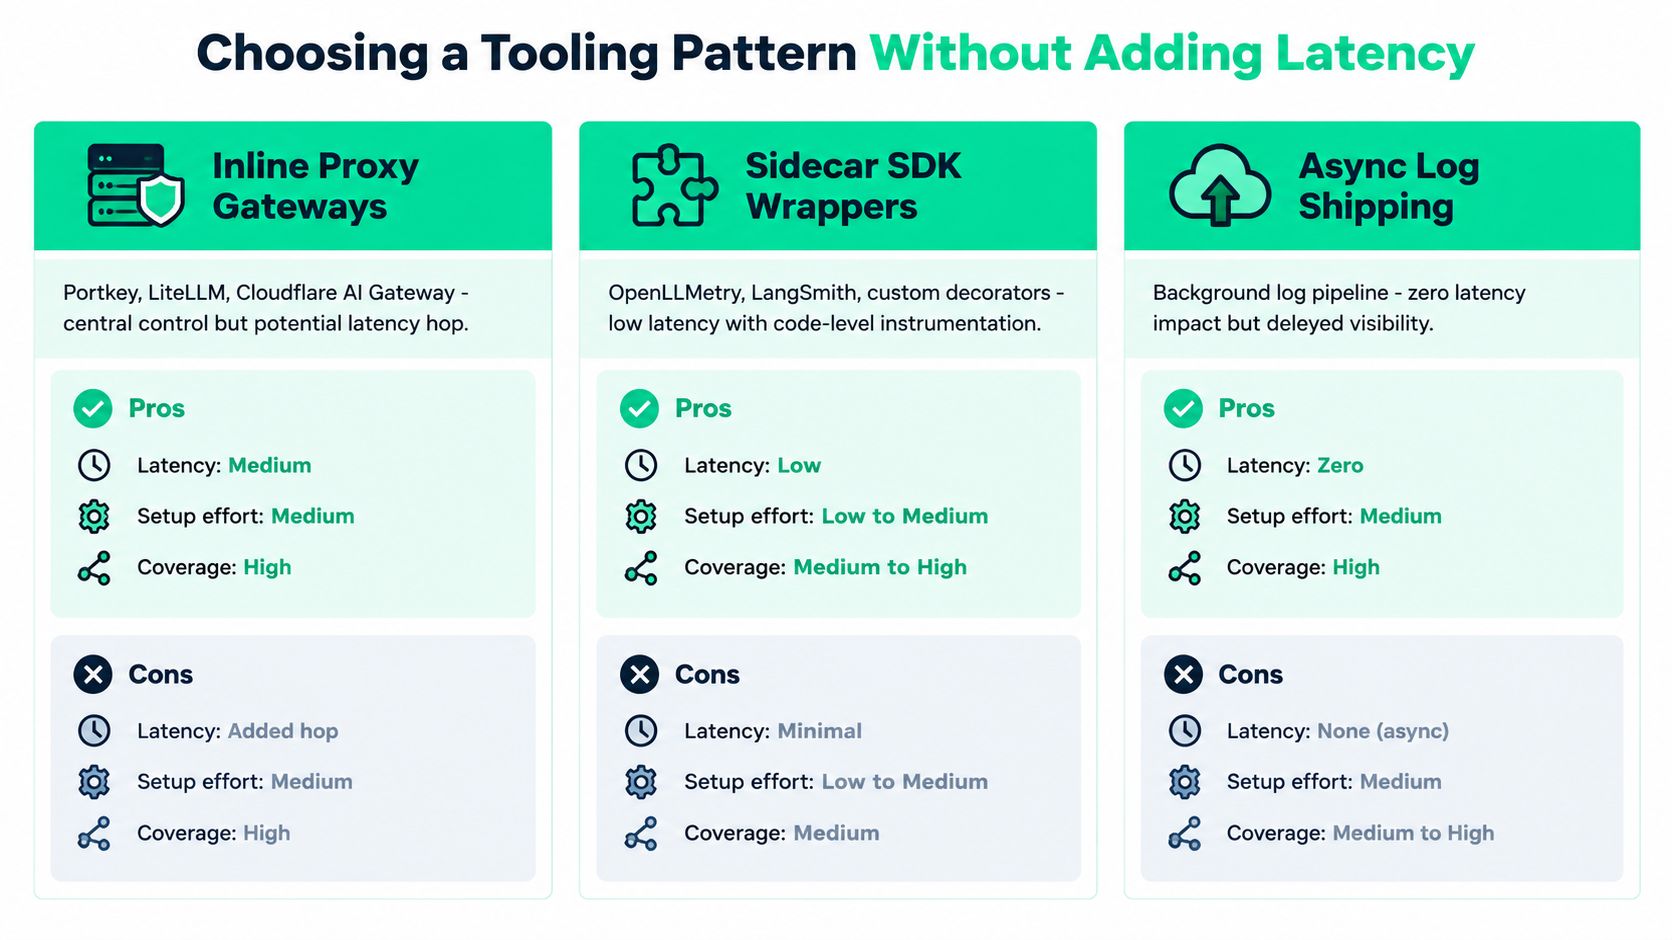
| Inline proxy gateway | Adds a network hop that must be tested | Strong central visibility when all calls use it | Higher if routing and policy become gateway-specific | Moderate |
| Sidecar SDK wrapper | Low when telemetry writes are asynchronous | Strong at code-level boundaries | Lower, especially with custom decorators | Moderate |
| Metadata-only log shipping | Near-zero request impact, visibility arrives later | Depends on application coverage | Low | Low to moderate |
Inline proxy gateways, including Portkey, LiteLLM, and Cloudflare AI Gateway, centralize policy, routing, rate limits, and provider controls. They can simplify governance, but a missed route or bypassed client leaves the same attribution gap the gateway was meant to solve.
Sidecar SDK wrappers, such as OpenLLMetry, LangSmith integrations, or custom decorators, preserve direct provider calls while recording application context. They work well when teams need request-level grouping and replay without forcing every service through a shared network component.
Async log shipping adds metadata to an existing observability pipeline. It may not provide immediate cost visibility, but it lets platform teams get useful coverage with limited application disruption. Teams often begin here, then adopt a sidecar when they need richer request context, and introduce a proxy when governance or multi-provider routing becomes a formal requirement.
Sequencing rule: Choose the least intrusive pattern that answers the next management question, then migrate when the missing control has a clear owner and business consequence.
From Per-Call Cost to Portfolio Forecasting
A portfolio forecast begins with observed usage, not a provider's headline rate. Engineering contributes call volume, token mix, model distribution, cache behavior, and planned releases. Finance converts those inputs into a rolling view of spend, margin, and budget exposure.
The planning unit is a successful business outcome. Depending on the product, that may be cost per conversation, resolved ticket, or generated document. Each feature launch needs an expected volume range and model mix, tested against scenarios such as higher cache adoption, model substitution, and a volume cap.
Build the planning table
| Input Metric | Source | Planning Output |
|---|---|---|
| Calls by feature | Gateway and application telemetry | Workload volume forecast |
| Input and output tokens | Provider response and event logs | Token budget |
| Model and region mix | Runtime metadata | Blended unit cost |
| Cache-hit behavior | Provider usage fields | Cached-input savings scenario |
| Successful outcomes | Product analytics | Cost per outcome and margin view |
| Planned launches | Product roadmap | Incremental spend case |
| Invoice reconciliation | Provider billing | Forecast variance and confidence |
A rolling 13-week view separates adoption-driven growth from prompt expansion and model-mix drift. Spending can rise even as per-token prices fall, because usage expands, prompts grow, or traffic shifts toward a frontier reasoning model. Each cause requires a different response: volume growth may support revenue, prompt bloat calls for engineering work, and model-mix drift may require routing policy or evaluation.
The market context reinforces portfolio planning. Gartner projects worldwide GenAI spending at $644 billion in 2025, up 76.4% from 2024, while TD Securities estimates GenAI represents 12% of cloud spend in 2025 and could reach 28% by 2028, as summarized in Gartner's forecast release. These figures do not determine an individual company's budget, but they show why token-rate reductions alone cannot explain portfolio growth.
Forecast quality depends on more than billing data. Teams need outcome volume, margin assumptions, release plans, and confidence ranges, then should compare actuals with each forecast cycle. For broader finance context, teams comparing planning methods can consult controller ROI benchmarks for SaaS.
The AI forecast should become a shared planning artifact for pricing, feature approvals, capacity decisions, and model governance. It should explain which workloads create value, which consume margin, and why the total bill changes.
Your First 30 Days With AI Spend Analytics
The first 30 days should establish visibility before optimization. Changing models before identifying tenants, features, prompts, and outcomes can lower the invoice while harming quality or moving spend into an untracked service. The objective is a usable cost model for each workload, not a lower total achieved without context.
Week-by-week operating plan
Week 1, instrument every call. Capture tenant, product, feature, environment, prompt template, model, and request identifiers. Reconcile gateway and application telemetry with provider invoices. Make coverage the first deliverable, then investigate every high-value event without an owner.
Week 2, establish baselines. Track input and output tokens, cost per call, cache-hit rate, and error rate. Add outcome fields already available in product systems, such as completed extraction or a resolved support interaction. These fields connect provider spend to unit economics rather than treating every token as equally valuable.
Week 3, ship low-risk savings. Find repeated system prompts, duplicated document context, oversized templates, and workloads suitable for caching. Trim context and test exact-match caching first. Earlier caching examples show that savings can be substantial, but the result depends on workload repetition, cache eligibility, and whether optimization changes quality or retry behavior.
Week 4, build the portfolio view. Combine volume, model mix, cache behavior, and business outcomes in a forecast. Give finance a base case plus branches for improved caching, model substitution, and usage controls. Rank each action by expected impact, confidence, and migration risk. A portfolio view also separates healthy bill growth from spend caused by prompt bloat, uncontrolled retries, or a shift toward more expensive models.
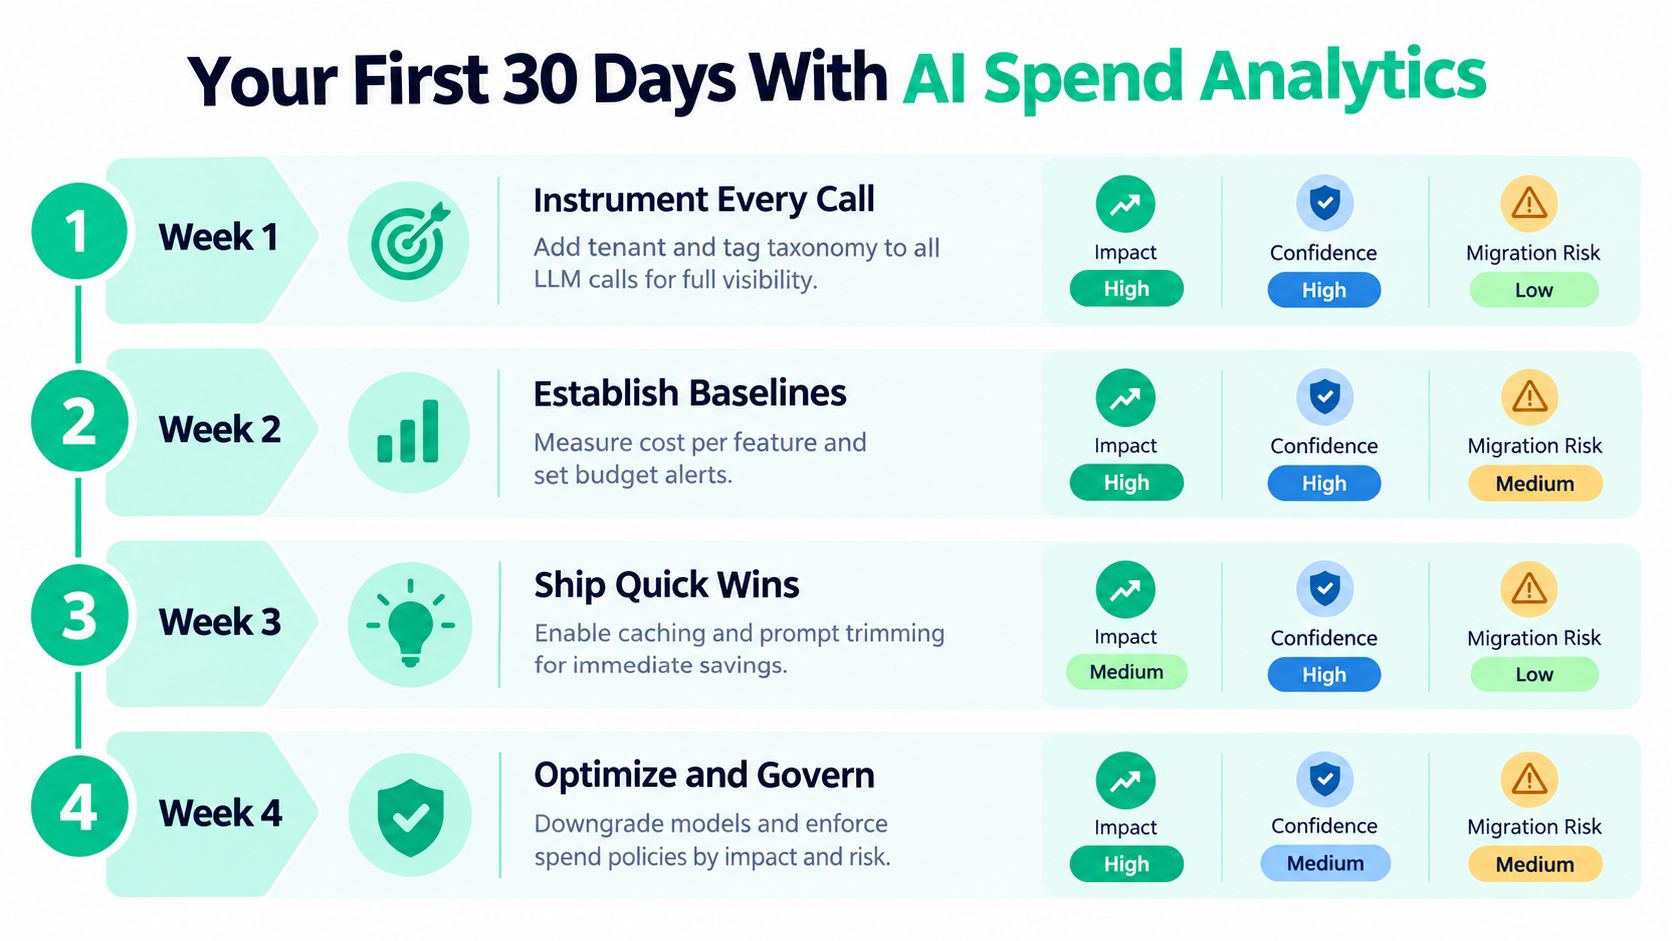
The sequence protects answer quality. Pair each proposed substitution with a small evaluation set measuring task accuracy before and after the change. A cheaper call that increases retries, escalations, or human review can raise cost per successful outcome even when the provider invoice declines.
SpendLens AI offers developer-focused instrumentation for OpenAI and Anthropic workloads, including workload-level spend breakdowns, cache-efficiency signals, prompt-waste detection, and model-switch recommendations with estimated savings, confidence, and migration risk. SpendLens AI connects runtime telemetry with portfolio-level AI cost decisions, helping teams turn provider bills into actionable unit economics.