AI Spending Tracker Explained and How to Cut LLM Costs
Learn what an AI spending tracker measures, key metrics, build vs buy tradeoffs, and how to evaluate tools to cut LLM costs with confidence.
You open the monthly AI invoice and recognize the total, but not the cause. Engineering knows the company spent more with OpenAI or Anthropic, yet nobody can say whether a new feature, a prompt change, retries, a different model, or an agent workflow created the increase. By the time the team investigates, the deployment has already become part of production behavior.
An AI spending tracker turns that invoice into an operating view. It connects provider charges to projects, features, workflows, models, and usage patterns, so engineering can act before a cost surprise becomes a budget problem. That matters as AI budgets move across departments and providers, and as infrastructure-scale consumption makes simple token totals less useful.
This guide builds the mental model step by step. You'll learn what a tracker measures, which metrics support real decisions, when building makes sense, how to evaluate a tool, and how to report findings to finance and engineering. The examples focus on practical value, including time saved during investigations and money saved through caching, prompt cleanup, and model selection. For a complementary approach to detecting unexpected changes, see this guide to cost anomaly detection.
Table of Contents
- Introduction Why AI Bills Feel Invisible Until They Spike
- What an AI Spending Tracker Actually Does
- Key Metrics Every AI Spending Tracker Should Measure
- Build vs Buy Deciding How to Track LLM Spend
- How to Evaluate AI Spending Tracker Tools With Confidence
- Sample Reporting That Engineering and Finance Actually Use
- Conclusion Turning Visibility Into Controlled AI Spend
Introduction Why AI Bills Feel Invisible Until They Spike
A provider invoice answers one question: how much did the account spend? It usually doesn't answer the questions that matter during a review:
- Which product feature generated the usage?
- Which team owns the workload?
- Did input tokens or output tokens drive the change?
- Did a retry loop multiply requests?
- Would a cheaper model handle the same task safely?
- Were repeated instructions eligible for caching?
Those questions turn a bill into an investigation. Without consistent metadata, an engineer may need to search application logs, deployment histories, provider dashboards, and spreadsheets before finding a plausible explanation. A finance analyst may see a rising charge but lack the technical context to challenge it or assign it accurately.
The pressure is no longer limited to a central AI team. Enterprise generative AI spending reached $37 billion in 2025, up from $11.5 billion in 2024, a 3.2x year-over-year increase, according to Menlo Ventures' 2025 enterprise AI analysis. The same analysis reports $7.3 billion in departmental AI spending in 2025, growing 4.1x year over year, which indicates that line-of-business teams now influence usage and budget decisions.
Practical rule: If you can't attribute a call to a workload, you can't reliably explain its cost or judge its return.
A useful tracker doesn't merely copy provider totals into another dashboard. It preserves the provider total as the financial source of truth, then adds the context your systems already know, such as project, endpoint, customer action, environment, release, and workflow type. It also normalizes pricing across providers and models, so a support classification task can be compared with another support classification task rather than with unrelated generation traffic.
By the end of this guide, you should be able to decide whether lightweight instrumentation is enough, whether a dedicated product is justified, and which reports will help your team avoid manual reconciliation. The target outcome is straightforward: less time spent explaining yesterday's bill, and more time spent preventing tomorrow's waste.
What an AI Spending Tracker Actually Does
Start with the raw material. Providers expose invoices, usage records, token counts, model identifiers, and, where supported, cache information. Those records describe consumption, but they rarely understand your product vocabulary. “Model X used these tokens” is not the same as “the checkout assistant used these tokens for failed-cart recovery.”
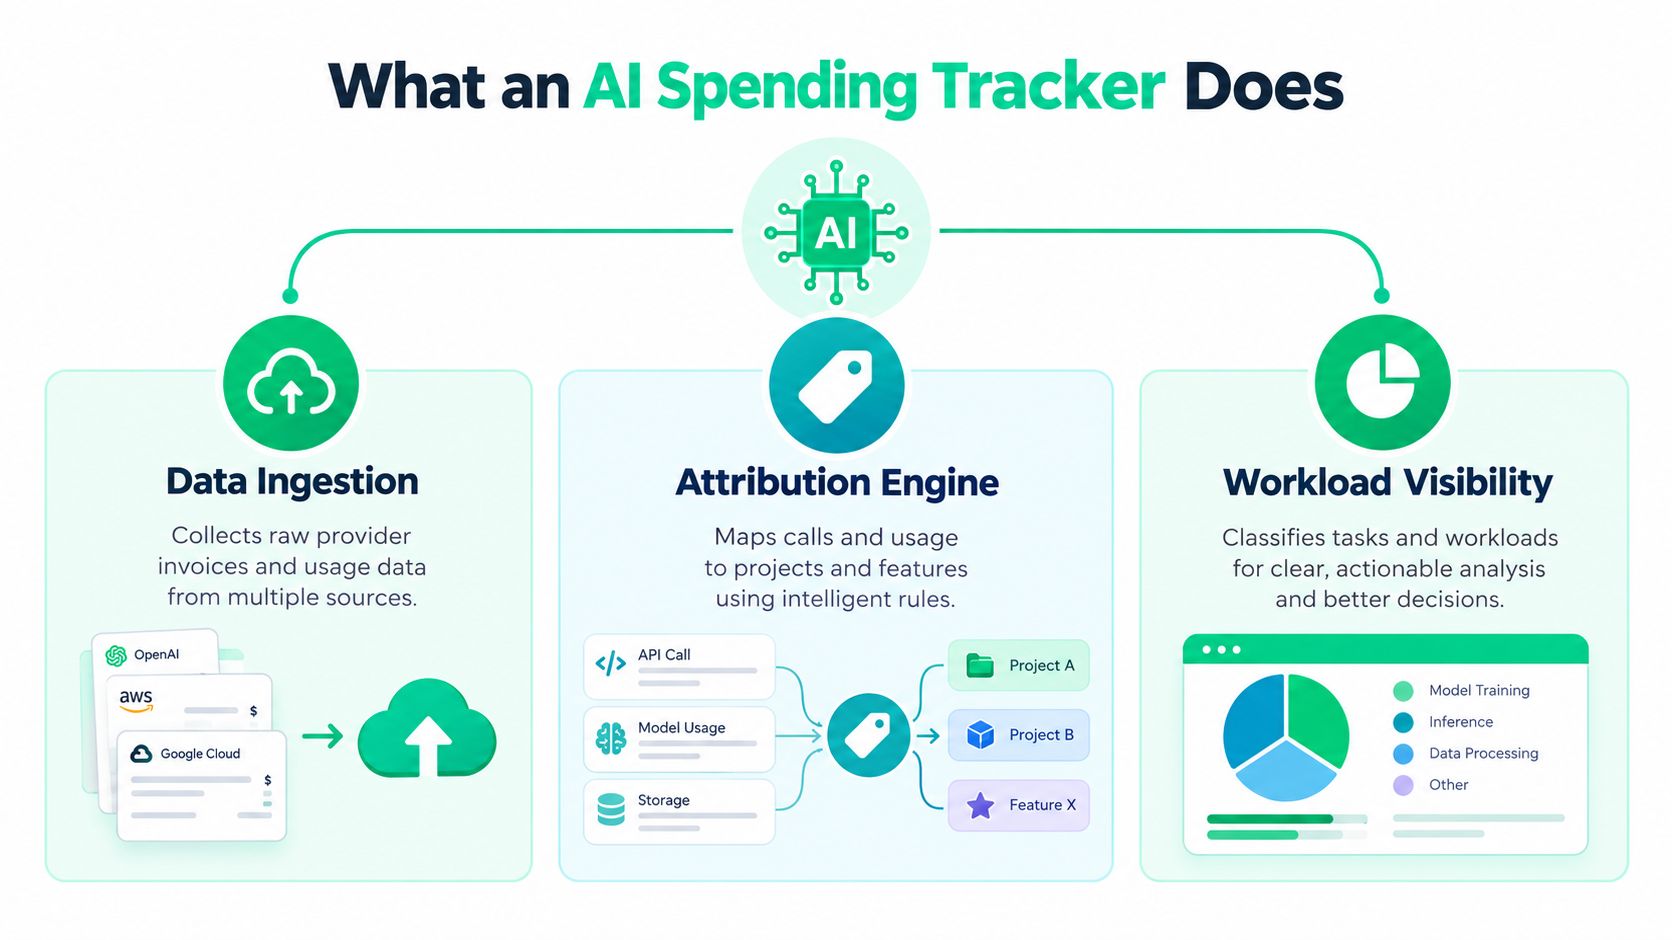
An AI spending tracker adds that missing layer through three connected functions:
- Data ingestion collects provider usage and billing data.
- Attribution attaches each call to an owner, project, feature, or workflow.
- Workload visibility groups comparable operations for analysis and forecasting.
From tokens to business context
Token counts are useful raw measurements. They aren't sufficient decisions because two workloads with similar token volume can have different model prices, output behavior, latency needs, or business value. A tracker should therefore show spend by project, provider, model, workload, input tokens, output tokens, and individual call where the underlying data allows it.
Think of cloud FinOps. A cloud invoice might show compute charges for an account, but a useful cost system maps those charges to services, environments, teams, and products. LLM tracking applies the same principle to inference calls. The “instance” becomes a model request, and the useful ownership labels become workflow and feature metadata.
Metadata-only tracking helps preserve privacy. Instead of storing user prompts and model responses, an implementation can record identifiers, token counts, model names, latency, environment, and hashed credentials. Template-only sampling can reveal prompt structure without retaining the full customer conversation. That gives teams cost context while limiting the amount of sensitive content in the tracking system.
Reconciliation matters
Your tracker should reconcile against provider-billed totals rather than pretending application telemetry is perfect. Missing events, failed requests, retries, streaming behavior, and provider adjustments can create differences. A reconciliation workflow, such as the guidance on building metering with DOM Studio, helps teams treat usage events as an auditable record rather than an approximate counter.
The practical test is simple. Ask whether a finance reviewer can start with the provider invoice, select a project, and trace the total to workloads and calls. If the answer is no, the system is displaying data, not providing cost visibility. For implementation patterns focused on application-level attribution, compare the tracker design with this guide to LLM cost tracking.
Key Metrics Every AI Spending Tracker Should Measure
A useful metric earns its place by changing a decision. Total tokens may describe scale, but they don't tell you whether a prompt is wasteful, a model is unnecessarily expensive, or an agent is generating cost through retries and tool calls. The following measures connect usage to action.
| Metric | What It Measures | Decision It Enables |
|---|---|---|
| Spend by project and feature | Ownership and product allocation | Which team or feature needs review |
| Spend by provider and model | Pricing and vendor mix | Whether a model switch is worth testing |
| Spend by workload | Comparable task economics | Which tasks are overpaying |
| Input versus output tokens | Where token volume originates | Whether to shorten context or constrain responses |
| Cache hit rate | Reuse of eligible context | Whether prompt structure should change |
| Per-call cost | Unit economics of a request | Whether a workflow can scale safely |
| Retry and handoff cost | Extra activity around a task | Whether orchestration needs tighter controls |
| Estimated savings and risk | Opportunity size and uncertainty | Which optimization to test first |
Ownership comes before optimization
Break spend down by project, provider, model, API key, environment, and workload. A rising total is an alert, not an explanation. If the tracker shows that a new release caused support summarization to consume more output tokens, the owner can inspect the prompt and response limits. If it shows that an experimentation workspace generated the increase, finance can separate exploratory usage from production economics.
This saves investigation time because people start with the responsible workload instead of searching every service. It also supports chargeback and product pricing decisions without forcing finance to interpret raw provider terminology.
Input, output, and prompt waste
Input tokens often grow through repeated system instructions, long conversation history, retrieved documents, or duplicated context. Output tokens can expand through unconstrained responses, verbose formatting, or agent handoffs. Track both sides separately, then add prompt waste signals for large templates, excessive context, repeated instructions, and long outputs.
A reusable system prompt illustrates why cache efficiency belongs beside token volume. OpenAI's automatic prompt caching applies after a stable prefix reaches 1,024 tokens, and cached tokens on supported models are billed at 50% of the normal input rate. A team that identifies a stable prefix can reduce the input-cost portion of eligible calls by half, while preserving the application's existing task logic.
Anthropic's model is different. Anthropic prompt caching bills cache reads at about 10% of the standard input rate, while cache writes cost 25% more than normal input on first use. For Claude Sonnet, the cited example moves from about $3.00 per million input tokens to $0.30 per million for cached reads, a 90% reduction on repeated context. The tracker should expose reads, writes, misses, and eligible opportunities, not just a single cache percentage.
Unit economics and model-switch decisions
Per-call cost makes a feature's economics legible. A support classifier that uses a premium reasoning model for every short label may look acceptable in aggregate, yet become expensive as volume scales. A tracker should compare equivalent workloads across models and show estimated savings with confidence and migration risk, so teams don't treat the cheapest price as an automatic replacement.
Caching results vary by provider and application pattern. In one repeated-prompt comparison, Claude Sonnet 4.5 fell from $0.39 on the first request to $0.04 on each of the next nine, producing 75.9% total savings versus no caching, while OpenAI produced 53.4% savings in the same test, as documented in real-world prompt caching testing. The time-saving equivalent is fewer manual experiments. Instead of guessing whether caching helps, an engineer can identify the repeated context, run a controlled test, and use observed cache behavior in the forecast.
Build vs Buy Deciding How to Track LLM Spend
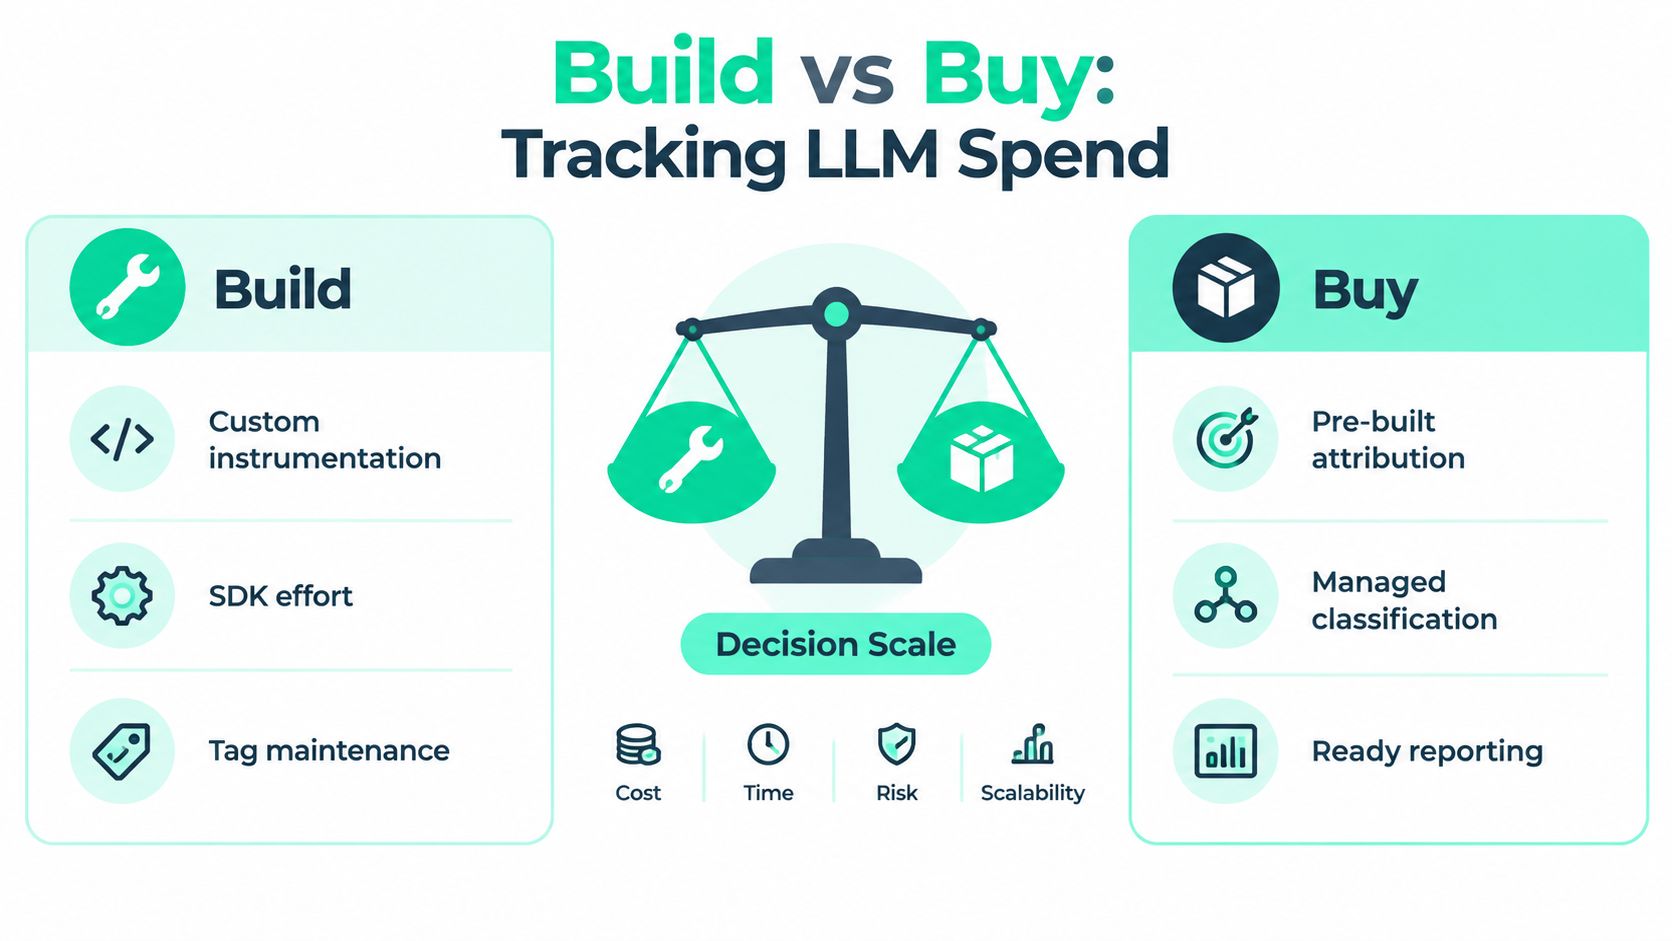
Building an internal tracker gives you control, but control comes with a maintenance surface. You need instrumentation in each service, consistent tags, provider pricing updates, reconciliation logic, workload classification, dashboards, access controls, and recommendations that remain useful as models change.
Buying a dedicated tool reduces that initial engineering burden, but introduces vendor dependency, subscription cost, and the need to validate data handling. The right choice depends less on ideology than on the number of providers, services, teams, and decisions the system must support.
What building really requires
A lightweight internal approach can work when one platform team owns a small number of services. A decorator or middleware wrapper can capture model, token, environment, workflow, and release metadata without changing provider clients. That can save implementation time compared with asking each application team to create its own logging format.
The difficult part starts after the first dashboard. Teams must maintain provider pricing, account for cached tokens, classify new workloads, reconcile missing events, and keep reports understandable to finance. Fragmented logging often looks cheap until an engineer spends several days stitching together records after a production change. The labor cost is not only the code. It's the recurring investigation and maintenance work.
What buying changes
A purchased tracker can provide prebuilt attribution, managed workload grouping, cross-provider comparisons, and savings recommendations. It can also reduce the time between instrumentation and the first useful report. Products such as SpendLens AI use lightweight instrumentation with existing OpenAI and Anthropic clients, provide metadata-focused tracking defaults, and surface spend drivers, cache efficiency, and model-switch opportunities.
Proxy architecture deserves separate scrutiny. A proxy can centralize traffic, but it may add latency, routing complexity, and another failure path. No-proxy instrumentation lets requests continue directly to providers while the tracker receives usage metadata, which preserves existing retries and client configuration.
For teams spending $2K to $50K per month, compare the cost of the product with the value of faster decisions, not only with the cost of writing an SDK. A model-switch opportunity found earlier can save money, while a daily report can replace recurring spreadsheet work. Use a structured TCO model for build vs buy that includes implementation, maintenance, governance, and the cost of delayed optimization.
How to Evaluate AI Spending Tracker Tools With Confidence
Run an evaluation with your own traffic shape. A polished dashboard can still produce weak decisions if it loses workflow context, treats every token as equivalent, or recommends a cheaper model without showing migration risk.
Begin with attribution. Tag one production workflow, one experiment, and one background job. Then verify that each record carries the expected project, feature, environment, model, provider, and release metadata. Check whether failed calls, retries, streamed responses, and asynchronous jobs appear consistently.
Test the analysis, not the interface
Use the same representative workload across two models and compare more than price. A credible tool should show input and output behavior, per-call cost, response quality evidence where available, and the assumptions behind any savings estimate. If it says a switch could save money, ask whether the estimate reflects actual workload volume and whether it includes a confidence rating and migration risk.
Workload classification is equally important. Group summarization with summarization, extraction with extraction, and classification with classification. Comparing total tokens across unrelated tasks can make a large document workflow look inefficient when it is doing more valuable work.
Cache visibility should answer operational questions:
- Eligibility: Does the system identify stable prefixes and repeated context?
- Reads and writes: Can you distinguish successful reuse from cache creation?
- Misses: Does it show where a prompt could be structured for better reuse?
- Value: Can it translate cache behavior into an estimated input-cost effect?
A team may catch prompt bloat before a new feature scales, saving both review time and future inference spend. It may also discover that an agent's tool calls and handoffs make a simple per-request forecast unreliable. Independent coverage cited in recent analysis of AI billing visibility reports that 98% of organizations run agentic workloads, while only 36% include them in cost reporting and only 11% forecast AI spend within 10% accuracy, down from 15% a year earlier. Those figures make uncertainty a test requirement, not a reporting footnote.
A reusable evaluation checklist
Before selecting a tool, confirm:
- Attribution accuracy: Can you trace a provider charge to a real workflow?
- Classification quality: Are comparable tasks grouped without hiding meaningful differences?
- Cache coverage: Are reads, writes, misses, and opportunities visible?
- Forecast discipline: Does the tool show assumptions, uncertainty, confidence, and risk?
- Privacy defaults: Does it avoid storing prompts and responses unless you explicitly enable sampling?
- Reporting fit: Can engineering and finance download the same reconciled view?
For broader observability context, review LLM observability tools, then validate every important claim against your own logs and invoices.
Sample Reporting That Engineering and Finance Actually Use
A report earns trust when it answers the reader's next question without requiring a meeting. Finance usually needs ownership, reconciliation, forecast movement, and budget risk. Engineering needs workload detail, release context, cache behavior, and a shortlist of safe tests.

The daily summary
Keep the executive view short:
- Yesterday's spend: Reconciled provider total and change from the normal operating baseline.
- Top cost driver: Project, feature, workflow, provider, or model responsible for the largest share.
- Highest-impact recommendation: One action with estimated savings, confidence, and migration risk.
- Forecast note: Expected direction, known workload changes, and uncertainty from retries or agent handoffs.
- Owner: The engineering or product team responsible for the next test.
This format prevents a common failure mode, where a dashboard contains every available metric but no decision. A finance leader can see who owns the increase, while an engineering lead knows which workflow to inspect.
The weekly engineering view
The weekly report should group costs by feature and workload, then break each workload down by model and provider. Show input tokens beside output tokens, cache reads beside cache writes, and retries or handoffs as separate cost contributors. This avoids misleading comparisons where one workflow appears cheaper only because its output or orchestration cost is hidden.
Add a recommendation table with four columns: opportunity, estimated monthly savings, confidence, and migration risk. An engineer can then prioritize a low-risk model comparison before investigating a complex agent redesign. Finance can retain the same estimate in planning without treating it as guaranteed savings.
A consistent downloadable format also removes repetitive spreadsheet preparation. Instead of manually copying provider records, joining them with project data, and rewriting the same summary, the team can spend that time reviewing exceptions and running tests. For reporting conventions that support shared ownership, use these best practices for reporting.
The dashboard should support the report, not replace it. Use the interactive view for investigation, the daily summary for accountability, and the weekly breakdown for planning. A short video can help teams align on how to read the dashboard before the first finance review.
Conclusion Turning Visibility Into Controlled AI Spend
An AI spending tracker becomes valuable when it changes how teams operate. The provider invoice remains the financial record, but attribution adds ownership, workload grouping adds fair comparison, and cache data exposes an optimization path that token totals conceal.
Start with one critical production workflow. Add stable tags for project, feature, environment, release, and workload, then reconcile the captured events with the provider view. Review input and output tokens, cache reads and misses, retry behavior, and model alternatives before expanding instrumentation across every service.
The payoff is practical. Engineers spend less time searching logs after a bill spike, finance gets a defensible allocation view, and product leaders can connect feature economics with usage. A recommendation that includes estimated savings, confidence, and migration risk is more useful than a generic instruction to “use a cheaper model.”
Share a concise daily summary with finance and a workload-level weekly report with engineering. That rhythm turns cost monitoring into a feedback loop, helping teams save investigation time and identify real opportunities to reduce LLM spend without weakening the product.
SpendLens AI adds lightweight instrumentation to existing OpenAI and Anthropic workloads, then surfaces spend by project, model, provider, and workflow alongside cache efficiency and model-switch opportunities. Visit SpendLens AI to instrument a critical workflow, review its cost drivers, and start building reports your engineering and finance teams can use.