
AI Spend Management: A Practical Guide to Cutting LLM Costs
Master AI spend management with actionable steps to track, attribute, and reduce LLM costs. Learn instrumentation, caching, and forecasting strategies that save
You're staring at an OpenAI invoice that's suddenly four times higher than expected. The product team says it came from “the new AI features,” engineering can see token counts, and finance wants to know which customer, workflow, or deployment caused the increase. Nobody can answer with confidence because the bill shows consumption, not business context.
That gap defines modern AI spend management. LLM costs vary with model choice, prompt length, output length, retries, caching, concurrency, and agent behavior. A dashboard that reports raw tokens can tell you that usage rose, but it can't tell you whether the extra spend produced a successful support resolution, a completed document extraction, or an experiment nobody uses.
The practical answer is to connect three layers: instrumentation that captures workload context, optimization that targets prompt and model inefficiency, and experiments that verify quality before rollout. That approach gives engineering and finance a shared view of cost, latency, reliability, and value.
Table of Contents
- Why AI Spend Management Is Now a Core Engineering Discipline
- Instrumenting LLM Calls for True Cost Attribution
- Dashboards and Metrics That Actually Reveal Spend Drivers
- The Three Biggest Levers for Reducing LLM Costs
- Running Savings Experiments and Forecasting AI Bills
- Connecting AI Spend to Business Value and ROI
Why AI Spend Management Is Now a Core Engineering Discipline
An engineering leader opens the monthly provider invoice and sees a sharp spike. The invoice separates models and accounts, but not the product feature that generated the calls. A new summarization workflow, a longer retrieval context, and an agentic retry loop all shipped during the same period. The team can investigate, but only after the money has already been spent.
That opacity has become common because LLM pricing is usage-based and provider SDKs generally don't know your internal business taxonomy. They know the model, request, and response. They don't know whether the call belongs to a chatbot, an onboarding workflow, an enterprise tenant, or a disposable prototype.
Traditional cloud FinOps often starts with resources such as compute instances, storage, and network services. LLM workloads add a stochastic layer. Prompt and completion tokens vary by request, users create uneven traffic, agents can make follow-up calls, and a single poorly bounded workflow can consume far more context than its product owner expected.
Practical rule: If a cost cannot be assigned to a feature, workflow, team, or customer segment, it isn't ready for serious optimization.
The shift is visible in adoption. A 2026 FinOps Foundation survey of 1,192 practitioners representing more than $83 billion in annual cloud spend found that 98% of organizations manage AI spend, compared with 63% in 2025 and 31% in 2024, as reported in this analysis of enterprise AI spending in 2026. The same survey found that 80% said overall AI spend increased during the prior six months, while 78% expected it to continue climbing, which turns cost control into a recurring operating discipline rather than a one-time cleanup.
The scale of the market adds pressure. Gartner projected $64.3 billion in worldwide spending on AI models and platforms in 2026, approximately 63% higher year over year, with generative AI model spending projected to grow approximately 117% and specialized model spending approximately 210%, according to this summary of AI spending forecasts. The same source describes Gartner's broader projection of roughly $2.59 trillion in worldwide AI spending in 2026 and data-center spending tied to AI surpassing $788 billion. These projections cover more than inference, which means infrastructure, platforms, and model classes all need visibility.
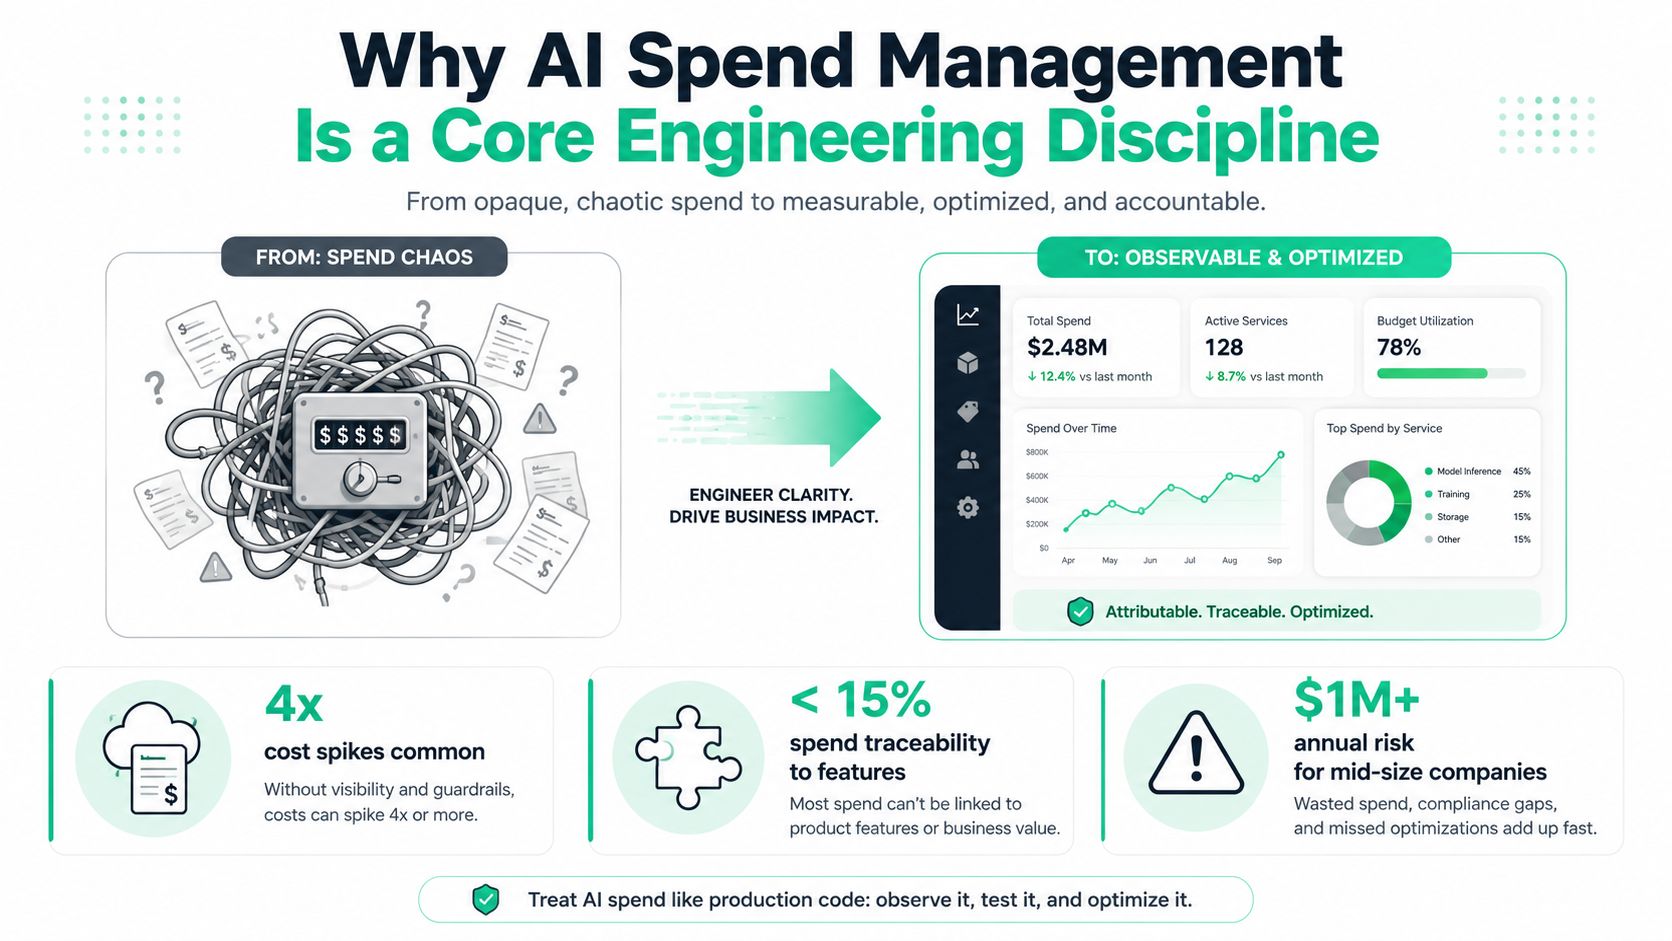
A team that waits for the invoice faces margin erosion and rushed decisions. Finance may impose broad limits, or product leaders may remove a useful feature because nobody can distinguish high-value usage from waste. Clear ownership and chargeback rules, as described in this guide to team accountability for AI costs, let teams optimize the expensive path without slowing every release.
Instrumenting LLM Calls for True Cost Attribution
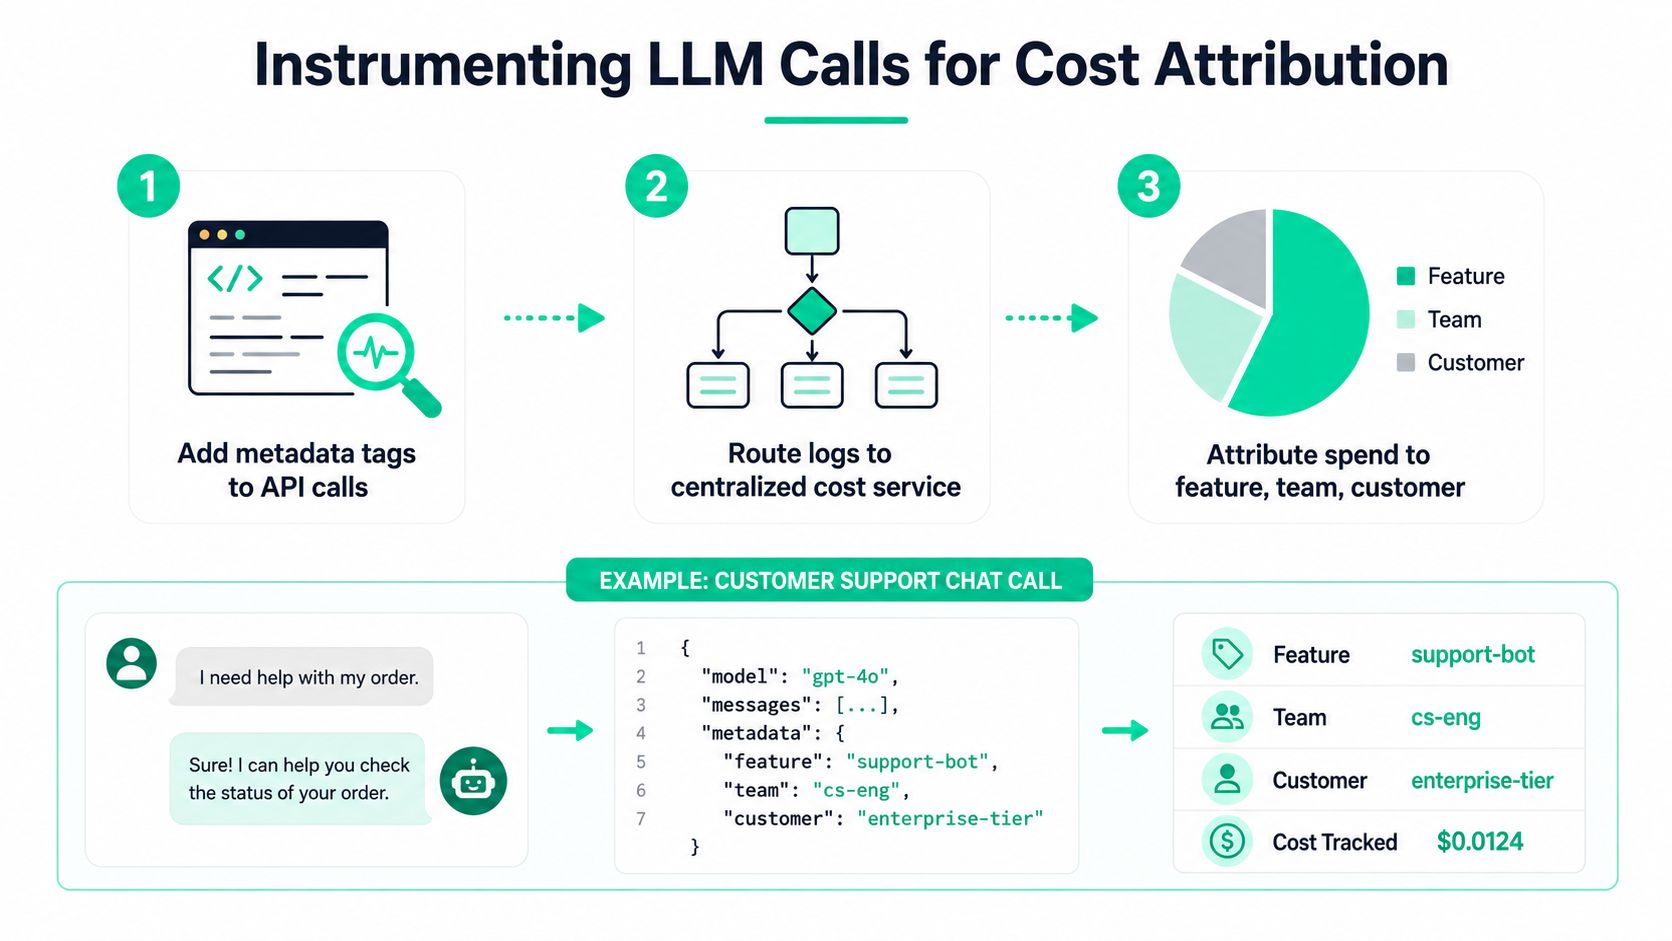
Token logging is a useful starting point, but it isn't attribution. A platform team needs to know who initiated the call, why the workflow made it, what model served it, whether the request hit cache, and whether the call succeeded.
The least disruptive pattern is a wrapper around the existing provider client. In Python, a decorator can attach metadata before the application calls OpenAI, Anthropic, or Bedrock. The application keeps its provider configuration, retries, and response handling, while the instrumentation layer records the context needed by finance and engineering.
@observe(
    feature="support-bot",
    workflow="answer-ticket",
    customer_tier="enterprise",
)
def answer_ticket(messages, correlation_id):
    return client.responses.create(
        model="chosen-model",
        input=messages,
        metadata={"correlation_id": correlation_id},
    )
The exact SDK syntax varies, but the design is consistent. Capture tags at the boundary where your application knows the business context, then attach provider usage after the response arrives.
The fields worth capturing
At minimum, each LLM event should include:
- Workload identity: Feature, workflow, task, endpoint, team, environment, and customer or tenant segment.
- Provider identity: Provider, model, project, API key or account reference, and deployment version.
- Token economics: Prompt tokens, completion tokens, total tokens, and cached input tokens where the provider returns them.
- Execution behavior: Latency, time to first token, completion status, retry attempt, timeout, and error type.
- Trace context: Correlation ID, parent span, request ID, and a stable operation ID for multi-call chains.
Streaming needs special treatment. Record usage when the stream closes, not only when the initial request is created. Otherwise, your dashboard can show latency and request volume while missing completion tokens or the final cache signal.
Retries also need their own event records. A failed first attempt still consumes resources, and an agent's tool call may trigger nested model requests that don't appear in the parent request unless the trace carries through the tool boundary.
Keep the integration outside the request path
OpenTelemetry semantic conventions for generative AI provide a useful vocabulary for spans and attributes. FastAPI middleware can attach request and tenant context, while Express middleware can propagate the same information through Node services. SDK hooks, such as those documented for AI observability platforms, can centralize collection without forcing each feature team to implement a separate logger.
Privacy matters. Store metadata by default, sample templates where necessary, and avoid retaining customer prompts or model responses unless there's a clear operational reason and appropriate controls. A hashed provider key, workload tag, and token record can support chargeback without creating a second repository of sensitive content.
Good instrumentation changes the questions a review can answer. Instead of “Why did tokens increase?”, the team can ask, “Which release increased completion length for the enterprise support workflow, and did successful resolutions rise with it?” That is the foundation for defensible optimization.
Dashboards and Metrics That Actually Reveal Spend Drivers
A token counter is not a cost-management dashboard. Two calls with the same token volume can have materially different economics because the models, cached input, output mix, and execution path differ. A useful dashboard translates provider usage into workload-level cost and then connects that cost to successful outcomes.
The first view should serve executives and budget owners. Show current burn, forecast against budget, provider and model mix, and the feature or team responsible for the largest change. The second should serve engineering. A workload heatmap can expose a small number of operations that consume a disproportionate share of spend. The third should serve incident response, with call-chain drill-down, token breakdowns, retries, cache status, and latency on the same trace.
Metrics that deserve attention
Cost per workload is more useful than total tokens. Group calls by feature, workflow, endpoint, and model so a product owner can see the cost of a successful operation rather than a provider-wide aggregate.
Effective cost per successful outcome adds quality and completion status. For a support bot, define the denominator as a resolved ticket or an accepted answer. For extraction, use a document that passes validation. The formula is:
effective cost per successful outcome = total workload cost / successful outcomes
Cache hit rate and cache savings ratio reveal whether repeated prefixes are being reused. A low hit rate on a workflow with stable system instructions points to cache-key or prompt-layout problems.
Prompt length trend catches context bloat before it becomes a billing surprise. Track median and tail behavior by workload, not only a global average, because a few long requests can dominate spend.
Per-customer allocation supports pricing and margin decisions. Enterprise tenants may justify richer context, while free or trial usage may need stricter limits. The dashboard should make that trade-off visible without hiding quality metrics.
| Vanity Metric | Why It Misleads | Actionable Replacement | What It Reveals |
|---|---|---|---|
| Total tokens | Blends cheap and expensive models, cached and uncached input, and unrelated workloads | Cost by model and workload | Which feature creates the bill |
| Request count | Treats a short classification call like a long agent chain | Cost per completed workflow | Whether orchestration is expensive |
| Average latency | Hides slow tails and retries | Cost, latency, and success by call chain | Whether cheaper capacity meets the SLO |
| Monthly provider total | Arrives too late for deployment response | Daily burn with release annotations | Which change altered spend |
| Cache hits | A hit count doesn't show economic impact | Cache savings ratio by workload | Where prompt structure needs work |
For capacity decisions, raw throughput can also mislead. A concurrency-aware LLM infrastructure methodology recommends measuring goodput, meaning the highest arrival rate that still meets real time-to-first-token, time-per-output-token, and end-to-end SLOs. Load-test the candidate configuration with your actual prompt, output, and arrival distributions. A system that looks cheap at vendor benchmark saturation may cost more in production when concurrency, batching, or latency constraints reduce usable capacity.
Alerts should be tied to ownership. Trigger an investigation when a deployment changes cost per successful outcome, prompt length, retry rate, or cache savings for a tagged workload. Reporting guidance such as these AI spend reporting best practices helps turn raw events into a review that product, engineering, and finance can act on.
The Three Biggest Levers for Reducing LLM Costs
A production assistant can show falling token prices while its monthly bill rises. The usual cause is workload mix: repeated system instructions, oversized retrieval context, and expensive models applied to tasks that do not need them. Treat these as connected controls, then measure savings at the workflow level rather than trusting raw token totals.
Prompt caching
Caching pays off when requests share a stable prefix, such as a system prompt, policy library, or repeated RAG context. Provider guidance supports caching for prompts exceeding 1,024 tokens and reports latency reductions of up to 80% for prompts over 10,000 tokens, figures summarized in this prompt caching breakdown. Cached input tokens can be 10 times cheaper than regular input tokens for OpenAI and Anthropic, and Anthropic reports latency reductions of up to 85% for long prompts, according to this prompt caching guide.
Put stable content before changing user content. Define cache keys around the reusable prefix, then specify which prompt or policy changes invalidate that key. Poor key design creates misses. Keys that cover too much content can serve stale instructions.
Instrument cache performance by workload, not only across the provider account. A high hit rate on low-volume traffic may matter less than a moderate hit rate on an agent workflow with large repeated prefixes.
Context reduction
Long context can preserve useful information, but it also adds irrelevant passages, latency, and input cost. Summarization chains, selective retrieval, field-level filtering, and removal of repeated instructions reduce the payload before inference. Start with redundancy, repeated boilerplate, and fields the task never reads.
The quality risk is silent. Dropping the policy clause that determines an answer can turn token reduction into operational rework. Track answer correctness, refusal behavior, citation quality, and task completion next to cost. The right target is the smallest context that still supports the required outcome.
Strategic model switching
Reserve expensive models for tasks where reasoning depth or output quality justifies the price. Route classification, extraction, formatting, and straightforward transformations to a smaller model only after testing representative examples. Model switching also changes latency, tool-use behavior, structured-output reliability, and failure modes.
Use a current LLM pricing comparison to separate list-price differences from the savings your routing mix can capture.
| Optimization Lever | Typical Savings | Implementation Effort | Quality Risk | Best For |
|---|---|---|---|---|
| Prompt caching | Up to 41% to 80% API cost reduction in an academic evaluation of long-horizon agentic tasks, with 13% to 31% time-to-first-token improvement, as reported in this prompt caching evaluation | Moderate | Low when prefixes are stable and invalidation is correct | Repeated system prompts, RAG contexts, and multi-turn workflows |
| Context reduction | Workload-dependent and should be measured rather than assumed | Moderate to high | Medium, especially for retrieval and policy tasks | Large templates, repeated documents, and broad retrieval |
| Model switching | Workload-dependent, with savings determined by provider prices and routing share | Moderate | Medium to high | Simple tasks with clear quality gates |
A Redis-cited benchmark found that a 100,000-token cached prompt reduced time to first token by about 79% and cached input cost by 90%, as described in this prompt caching benchmark. The practical implication is straightforward: cache savings belong in the same review as model selection, with latency and quality attached.
Agentic workloads require separate analysis. One study found they consumed about 1,000 times more tokens than code reasoning or chat workloads, with run-to-run token usage varying by up to 30 times on the same task. Higher token use did not reliably improve accuracy, and some frontier models underestimated their own token costs, with correlations as low as 0.39, according to the agentic reasoning token study.
Apply the levers in sequence, then test their combined effect. Caching lowers repeated-prefix cost, context reduction removes unnecessary input, and routing lowers the price of the remaining call. Report cost per accepted outcome, with quality and latency beside it. A classification workflow may benefit from all three changes, but only a workload-level experiment can show whether the product result improved.
Running Savings Experiments and Forecasting AI Bills
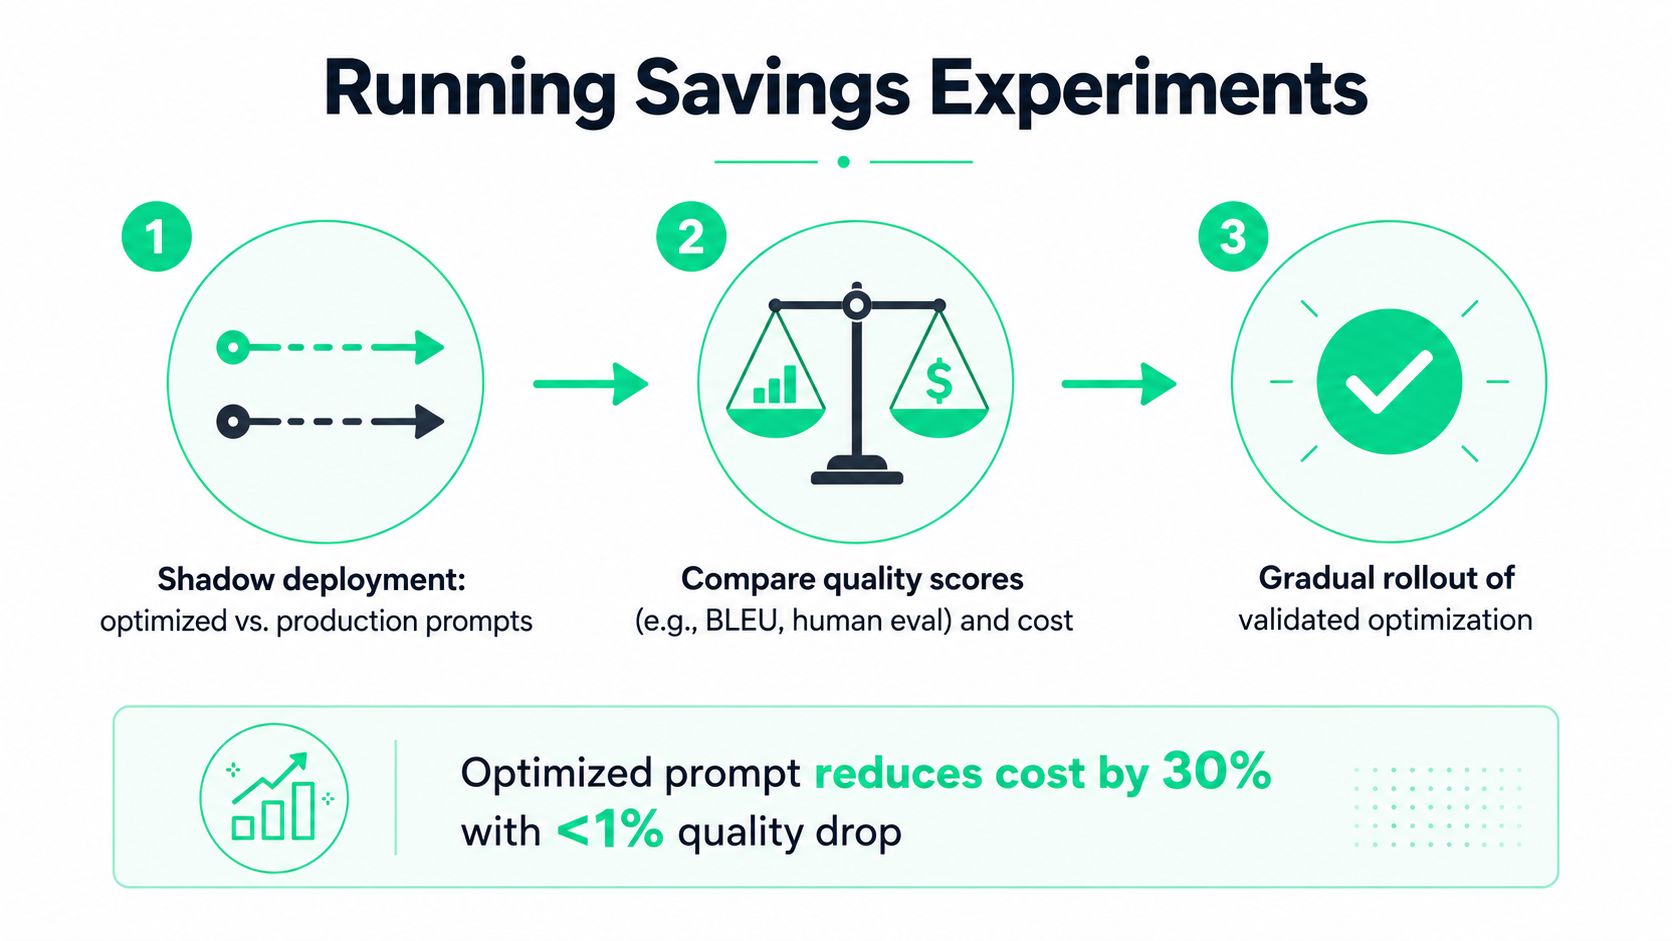
Optimization should enter production as a controlled experiment, not as a configuration change followed by hope. Start with a representative evaluation set from real workloads, including easy cases, long-context cases, failed requests, and tool-use paths.
A practical sequence looks like this:
- Shadow the optimized path. Run the candidate prompt, cache layout, or model beside production without changing the user-visible answer. Record token cost, latency, retries, structured-output validity, and task-specific quality.
- Compare outcomes, not just text. Use semantic similarity where it helps, but include human evaluation samples for support, judgment, and safety-sensitive workflows. For extraction, validate fields against a trusted reference. For agents, verify that the task completed and the tools were used correctly.
- Define goodput before rollout. Calculate successful outcomes that satisfy the SLO, then divide workload cost by that count. A lower per-call price isn't a win if failures create manual rework or additional retries.
- Canary the change. Route a controlled portion of eligible traffic to the candidate and set automatic rollback conditions for error rate, latency, invalid outputs, or quality regressions.
- Review by workload. A model switch may work for ticket classification and fail for escalation summaries. Keep the decision at the task level rather than applying a provider-wide rule.
Forecasting needs the same discipline. Use historical workload cost, request volume, prompt and completion distributions, provider mix, and feature adoption assumptions. A simple forecast can be expressed as:
forecast spend = expected successful workloads × expected cost per successful workload
For a richer service, calculate each workload separately, then add fixed platform costs and expected retry or failure overhead. Compare the forecast with actuals after each reporting period, and annotate deployments that changed prompt length, routing, or traffic.
Don't claim savings from a lower unit cost while product adoption is accelerating. Absolute spend can rise even as cost per successful outcome falls. Report both values: the optimization effect and the growth effect. That distinction lets a CFO see whether higher spend funds more completed work or reflects uncontrolled inefficiency.
Connecting AI Spend to Business Value and ROI
Engineering cost becomes useful to leadership only when it connects to an outcome. A support workflow should be evaluated by cost per resolution, an extraction pipeline by cost per document processed successfully, and a recommendation system by cost per conversion. Token volume is an input, not the business result.
Add business context at the same point where you add technical tags. Include customer tier, product feature, funnel stage, experiment ID, and outcome status. A support-bot call tagged only with model=... can support billing reconciliation. The same call tagged with feature=support-bot, customer_tier=enterprise, and outcome=resolved can support a product and pricing decision.
The 2025 State of FinOps report says 63% of organizations were tracking AI spend, up from 31% the year before, while framing the management challenge around understanding cloud usage and cost and quantifying business value, as described in this State of FinOps coverage. The implication is practical: visibility is becoming easier, but value attribution still requires product instrumentation.
A portfolio view for CFO and CTO reviews
Present AI features as investments with distinct economic profiles:
- Revenue-linked workflows: Compare conversion or expansion outcomes with the cost of the model calls that support them.
- Operational automation: Track cost per successful resolution, processed document, or completed internal task.
- Experiments: Set a budget and an exit condition. If usage grows without adoption or measurable operational value, stop funding it.
- Strategic capabilities: Separate platform learning from near-term return, then document the assumptions and review date.
A feature that consumes more tokens but improves retention or reduces manual work may deserve additional budget. A feature with low usage and no measurable outcome may need a smaller model, tighter limits, or retirement. That decision is impossible when finance sees only a provider invoice and engineering sees only a token counter.
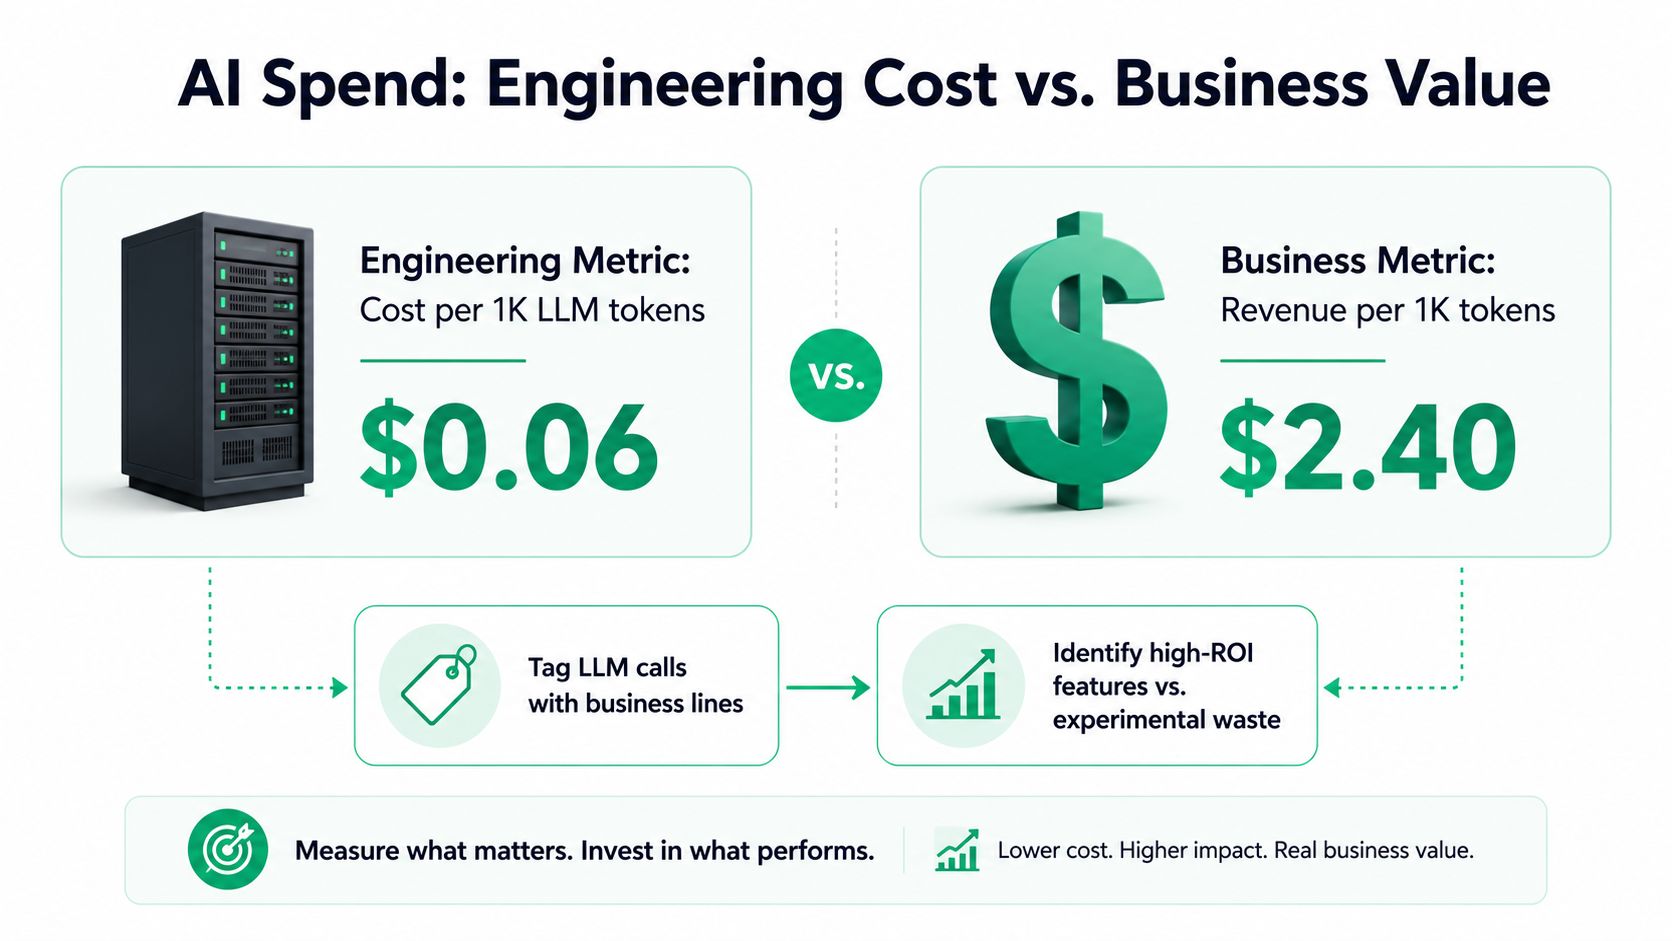
In quarterly reviews, show spend as a portfolio. For each capability, report allocated cost, successful outcomes, unit economics, quality trend, latency, adoption, and the next optimization experiment. That format changes the conversation from “Why is AI expensive?” to “Which AI investment should receive more capacity, and which should we redesign?”
SpendLens AI adds lightweight instrumentation to existing OpenAI and Anthropic services, attributes calls to workflows and features, surfaces cache efficiency and prompt waste, and ranks model-switch opportunities with estimated savings and migration risk. Visit SpendLens AI to connect workload-level cost data with the experiments and business outcomes that should govern your AI budget.