AI Token Cost: A Practical Guide to LLM Pricing in 2026
Understand AI token cost in 2026. Learn how providers price tokens, what drives spend, and how engineering and FinOps teams can cut LLM bills

Effective AI token cost in production commonly lands between roughly $0.07 and $0.72 per million tokens, depending on workload mix, not headline model pricing. The useful question is what each workload costs per request after prompt length, output volume, model choice, and cache behavior are included.
That range is counterintuitive because a provider's rate card looks precise. Yet the same model can produce very different invoices for two teams running different prompts, generating different response lengths, and achieving different cache reuse. OpenAI's published pricing shows rates ranging from $0.05 per 1 million input tokens on some text models to $10 per 1 million input tokens and $50 per 1 million output tokens on higher-end models as of September 2026, while historical changes inside one product line also show input, cached-input, and output prices moving independently (OpenAI API pricing).
The practical implication is simple: AI token cost is a workload-economics problem. Finance needs the blended cost of a resolved ticket, generated document, or active customer, while engineering needs to know which prompt, model, or cache pattern creates that cost.
Table of Contents
- Why Model Price Lists Mislead Teams About AI Token Cost
- How Tokens Actually Become a Bill
- How Providers Price Tokens in 2026
- The Biggest Drivers of Token Spend
- A Real Cost Reduction Playbook With Numbers
- Measuring and Attributing Token Spend Across Providers
- Prioritizing Optimization Levers by Impact and Risk
- Forecasting, Chargeback, and the Questions Leaders Ask First
Why Model Price Lists Mislead Teams About AI Token Cost
A rate card shows the provider's charge for input or output. It does not show how many tokens a product sends, how much context repeats, or whether routing sends a short request to an expensive model. The production invoice combines all of these choices.
One pricing analysis reports a weighted average of $0.72 per million tokens across real usage, while some production tiers reach $0.07 to $0.40 per million tokens at the low end (LLM pricing calculator). The figures describe different workload mixes. Compact prompts and short responses can place a team near the lower end. Long system instructions, verbose outputs, and limited cache reuse can raise the effective cost for the same nominal token volume.
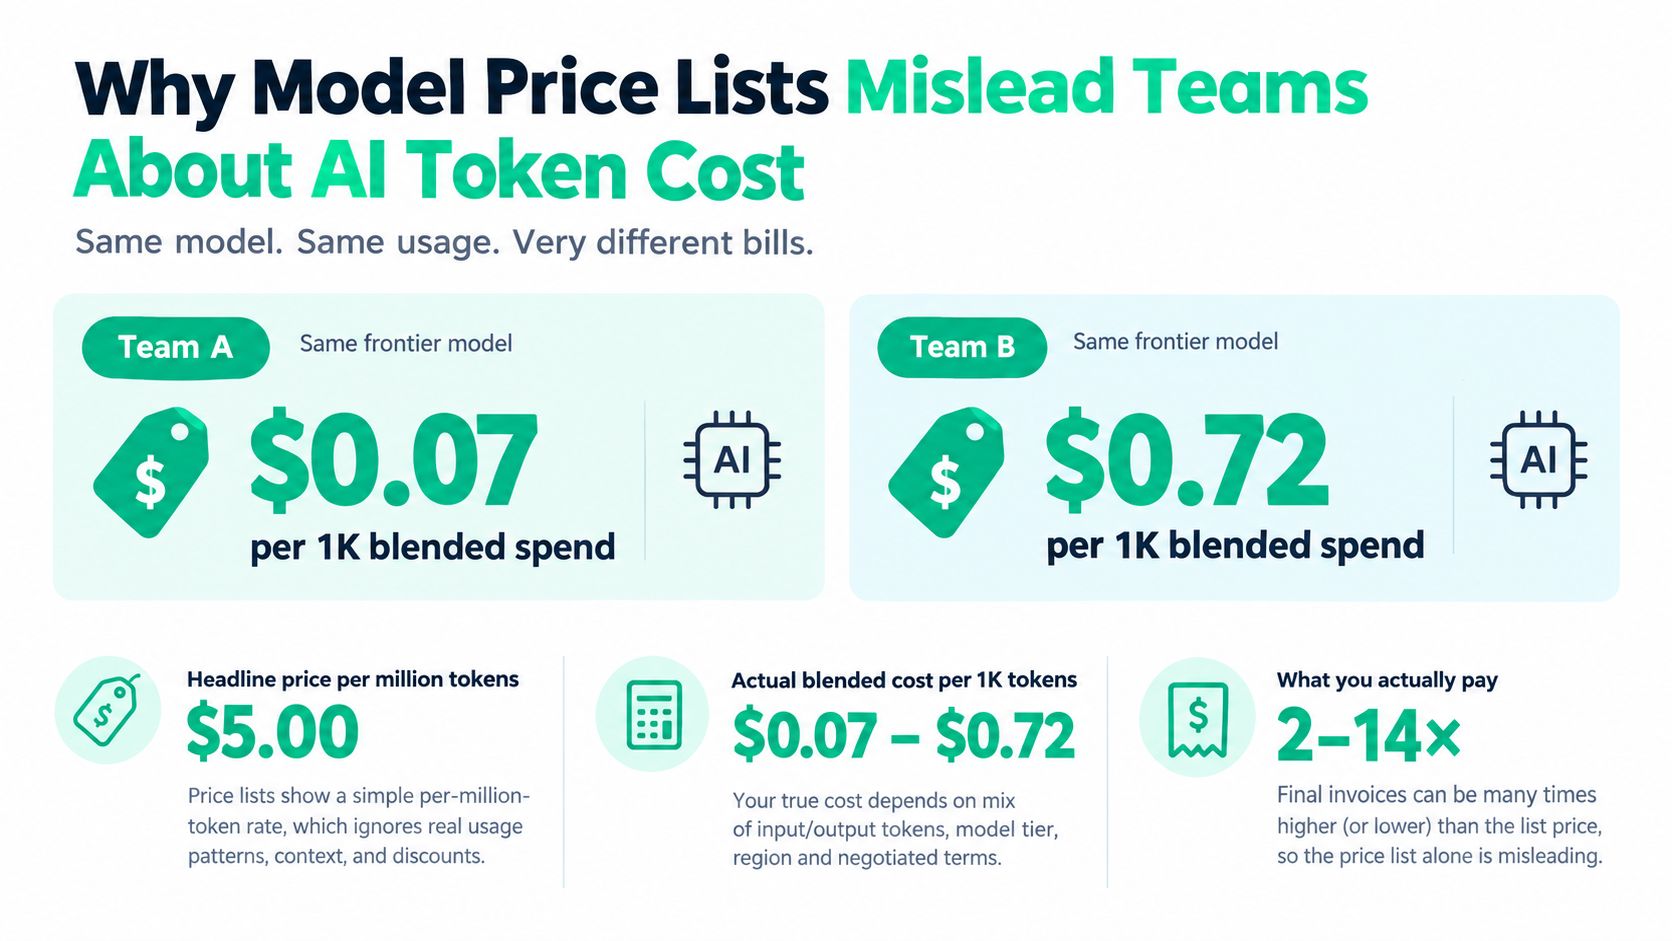
The invoice has more dimensions than the price list
Input rates receive attention because they are easy to compare. Output rates can matter more for requests that generate long explanations. Model comparisons also need to separate premium reasoning work from routine classification, extraction, and routing.
A useful cost model includes:
- Prompt composition: System instructions, few-shot examples, retrieved documents, tool definitions, and conversation history all add input tokens.
- Response behavior: Longer model responses can erase savings from a lower input rate.
- Cache economics: Reused prefixes may receive a discount, while writes, storage, eligibility rules, and cache misses determine the effective result.
- Model mix: A blended workload combines low-cost operations with premium calls, so one headline rate hides the actual distribution.
Historical pricing makes rate-card comparisons harder to interpret. A 2026 synthesis using Stanford HAI AI Index data reports that a GPT-3.5-level system fell from about $20.00 to $0.07 per million tokens between November 2022 and October 2024, a decline of more than 280× (LLM token price index). Lower market prices do not automatically reduce a company's bill if prompts expand, outputs become more verbose, or routing sends more traffic to costly models.
Practical rule: Compare cost per completed business outcome, not just cost per million tokens.
The same accounting applies when AI is embedded in analytics products. The overview of AI credits in business intelligence helps teams translate model usage into product economics. For a provider-by-provider baseline, maintain an LLM pricing comparison, then reconcile it with request-level telemetry.
How Tokens Actually Become a Bill
A token is a billing unit created by the provider's tokenizer. The model doesn't charge by characters or words directly, so a visually short prompt can consume more tokens than expected when it contains JSON, code, repeated labels, or function definitions.
Consider a customer-support request with 1,200 characters, roughly 320 input tokens, and a response of 180 output tokens. Suppose 240 tokens come from a reusable cached prefix. The provider may report fresh input, cached input, and output as separate categories, each with its own price or discount.
A worked request
The table below is a mental model, not a universal invoice format. Providers expose different field names and pricing rules, so confirm the exact treatment in the provider's usage response.
| Component | Characters | Tokens | Billed As |
|---|---|---|---|
| Customer question and instructions | 1,200 | 320 input | Fresh input, except any eligible cached prefix |
| Reusable system and policy prefix | Included in prompt | 240 cached | Cached input or cache read |
| Model response | Not fixed before generation | 180 output | Output tokens |
| Total reported usage | Varies | 500 token events | Input, cached, and output categories reconciled separately |
A rough English-language estimate can help during design. English text averages about 0.75 tokens per word, but that shortcut becomes less reliable with source code, tables, XML, JSON, multilingual text, and long identifiers. A prompt containing a few-shot example may look compact to a reviewer while carrying a large hidden token payload.
What engineers should inspect
- Whitespace and formatting: Pretty-printed JSON and verbose markdown add structure that the model must process.
- Tool definitions: Function names, parameter descriptions, and schemas can repeat on every request.
- Conversation history: Passing the entire thread preserves context but may re-bill old material.
- Tokenizer differences: The same text can produce different counts across model families.
- Output limits: A maximum output setting controls exposure, but it doesn't guarantee the model will use the full allowance.
The first instrumentation target is therefore not the monthly invoice. It's the request record: fresh input tokens, cached read tokens, output tokens, model, endpoint, and business workflow. Once those fields exist, a team can calculate the cost of a single support response rather than infer it from an aggregate dashboard.
How Providers Price Tokens in 2026
Provider price lists describe rates, not workload economics. The invoice depends on fresh input, output, cache reads or writes, and any tier or commitment arrangement. OpenAI's published API table spans models priced from $0.05 per million input tokens to higher-end offerings reaching $10 per million input tokens and $50 per million output tokens as of September 2026 (OpenAI API pricing).
The comparison below keeps unsupported fields qualitative. A static table cannot represent every model, region, or contract.
| Provider / Model | Input ($/Mtok) | Output ($/Mtok) | Cache Read ($/Mtok) |
|---|---|---|---|
| OpenAI, lower-priced text tier | From $0.05 | Model-dependent | Model-dependent |
| OpenAI, higher-end tier | Up to $10 | Up to $50 | Model-dependent |
| Anthropic | Tier and model-dependent | Tier and model-dependent | 10% of base input price for eligible cached reads |
| Google and hosted open-source providers | Model and tier-dependent | Model and tier-dependent | Provider-specific |
Output changes the comparison
A model with a lower input rate can still produce a higher blended bill if it generates longer responses, needs more retries, or performs poorly on structured tasks. Compare models with a fixed evaluation set that includes representative prompts, expected formats, retry behavior, and quality checks. The relevant metric is cost per successful task, not cost per million input tokens.
Caching changes the economics again. Anthropic's documented pattern bills eligible cache reads at 10% of base input price. A first write costs 25% above standard input for a 5-minute cache and 2× input price for a 1-hour cache (OpenAI versus Anthropic pricing). Those terms reduce the price of reused content, but they do not discount every token in the request. Cache eligibility, reuse frequency, and retention therefore determine whether the feature changes the invoice.
Provider selection should also distinguish enterprise access from API consumption. Seat or contract pricing may suit a managed deployment, while API economics depend on request-level usage. Guidance on how to find ChatGPT Enterprise rates helps frame that distinction, but an agreement does not replace measurement of model, token category, and workflow usage. Two teams can accept the same headline rate and receive materially different blended costs because their prompts, outputs, retries, and cache reuse differ.
The Biggest Drivers of Token Spend
Four forces usually determine whether a workload is economical: prompt size, output verbosity, template repetition, and cache behavior. The provider's listed rate matters, but these workload properties decide how often the rate is applied.
A useful example uses a customer-support prompt with 1,200 input tokens and a 300-token reply, producing an estimated $0.0034 per request under the stated workload assumptions. Trimming the prompt to 600 tokens, capping the reply at 150 tokens, and adding caching reduces the estimated request cost to about $0.0009. Those figures are scenario estimates, not universal provider rates, so teams should replace them with their own current rate card and telemetry.
| Driver | Before (tokens) | After (tokens) | Cost per Request | Notes |
|---|---|---|---|---|
| Prompt context | 1,200 input | 600 input | About $0.0034 before optimization, about $0.0009 after | Remove duplicated policy text and stale examples |
| Response length | 300 output | 150 output | Included in the scenario estimate | Use structured limits and concise formats |
| Reusable prefix | Cache misses | Cache-enabled reuse | Included in the scenario estimate | Savings depend on eligibility and hit rate |
| Template overhead | Repeated boilerplate | Curated template | Lower blended cost | Audit every request, not just the template file |
Prompt size is a recurring tax
A system prompt copied into every call behaves like a subscription charge. Few-shot examples, tool schemas, retrieved documents, and conversation history can all expand the input without changing the user's visible request. Engineers should measure the largest templates and ask whether each instruction earns its place.
Output creates a second exposure. A request that needs a label or a short JSON object shouldn't receive a multi-paragraph explanation. A maximum output setting, schema validation, and endpoint-specific instruction can reduce waste, but teams must test whether tighter limits increase retries or incomplete answers.
The cheapest token is the one the application never sends.
Cache misses deserve equal attention. A long static prefix can be economical when requests arrive frequently and reuse is high, but a low-hit workload may pay write premiums or storage charges without receiving enough discounted reads. The cost-driver framework is useful for ranking these sources before engineers rewrite prompts that weren't responsible for much spend.
A Real Cost Reduction Playbook With Numbers
A representative mid-sized SaaS team reduced its monthly OpenAI bill from $48,000 to roughly $19,000 over one quarter, without changing product features. The result came from combining four operational changes rather than searching for one miraculous model switch.
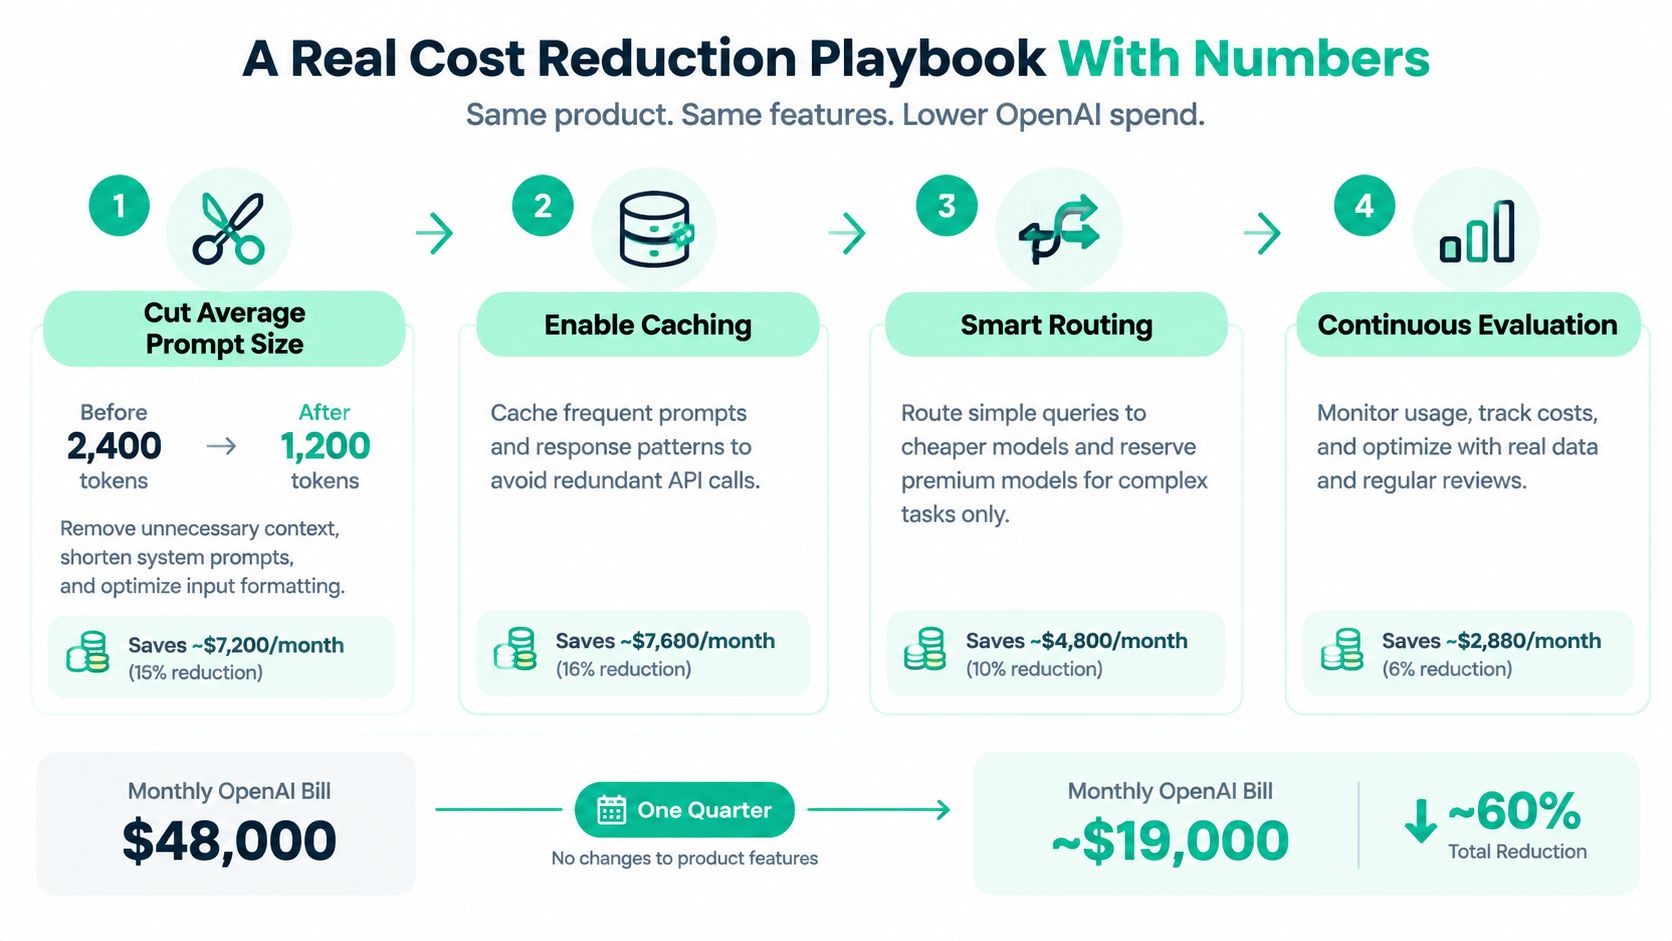
The sequence mattered
Trim the prompt first. The team reduced average prompt size from 2,100 to 900 tokens by removing duplicated system instructions and replacing a broad few-shot library with a smaller curated set. This step saved about 28% of the bill. The trade-off was template rework and a need to retest edge cases.
Cache stable context. A static 600-token prefix became eligible for prompt caching. Cached reads reduced the repeated input cost by roughly 90%, producing another 22% saving in the team's workload. Cache misses introduced latency variation, so the service kept a fallback path and monitored cold requests.
Route simple calls. Short classification requests moved to a smaller model priced at one-tenth the input price of the prior model, saving 15%. The team didn't route every task downward. It used evaluation tests to keep complex reasoning and customer-facing generation on the stronger model.
Control output. Summarization endpoints received a 250-token output cap, saving the remaining 12%. The cap required format changes because some summaries previously included redundant context and explanations.
The savings percentages describe the representative case's staged contribution, not a promise for another workload. A different team might find that output dominates, while another may have little reusable context and gain more from routing.
The playbook works because each step attacks a different billing mechanism. Prompt trimming reduces demand, caching reduces the price of eligible repeated input, routing changes the model tier, and output controls limit the most expensive generated material.
A production rollout should pair every cost change with quality checks, latency monitoring, retry tracking, and an endpoint-level before-and-after comparison. A lower invoice isn't a win if support agents receive incomplete answers or a higher retry rate recreates the spend.
A practical guide to LLM cost optimization can help teams turn those changes into repeatable engineering work.
Measuring and Attributing Token Spend Across Providers
Engineering and FinOps need one shared record for every meaningful request. Provider dashboards show aggregate consumption, while application telemetry explains which feature, tenant, or workflow caused it. Neither view is sufficient alone.
Start at the SDK layer. Capture the provider's usage fields, such as prompt_tokens, completion_tokens, and cached_tokens when available. Store the model, provider, request timestamp, status, latency, retry count, and a stable workload identifier alongside those counts.
Build the attribution grain
Tag every call with dimensions that match how the business manages cost:
- Feature: Support assistant, document generation, search, or classification.
- Tenant: Customer, workspace, or account responsible for usage.
- Model: Exact model identifier, not just a provider family.
- Environment: Production, staging, experiment, or batch job.
- Outcome: Resolved ticket, generated document, completed workflow, or failed attempt.
A warehouse table can then join request telemetry to provider usage exports and invoices. The reconciliation process should compare billed input, output, cached, and any applicable reasoning or tool charges against the provider's official records. Exporting usage files directly to a warehouse or object store avoids relying on dashboard panels designed for exploration rather than accounting.
Finance needs an allocation key. Engineering needs a request trace. Store both on the same event.
A dashboard can overcount cached reads if it adds token categories without understanding how the provider reports them. It can also understate tier-priced spend if it multiplies all tokens by a public list rate instead of applying the contracted or effective rate. Reconciliation should therefore happen at the provider invoice level, with exceptions sent back to the owning service.
The useful business metrics are outcome-based:
- Cost per active user
- Cost per resolved ticket
- Cost per generated document
- Cost per successful workflow
Raw token counts help diagnose waste, but they won't survive a board review unless leaders can connect them to revenue, retention, productivity, or service volume. Teams implementing this model can compare their options with cost allocation methods, then standardize the resulting dimensions across providers.
Prioritizing Optimization Levers by Impact and Risk
Not every cheaper token deserves production traffic. A model switch can lower the rate while increasing retries, weakening answer quality, or creating support work. Prompt compression can reduce input but remove context that prevents expensive downstream failures.
Use three scores for each high-spend endpoint:
- Magnitude: How much of the blended bill could the change affect?
- Confidence: How clearly does telemetry connect the lever to the cost?
- Migration risk: What could break in quality, latency, safety, or reliability?
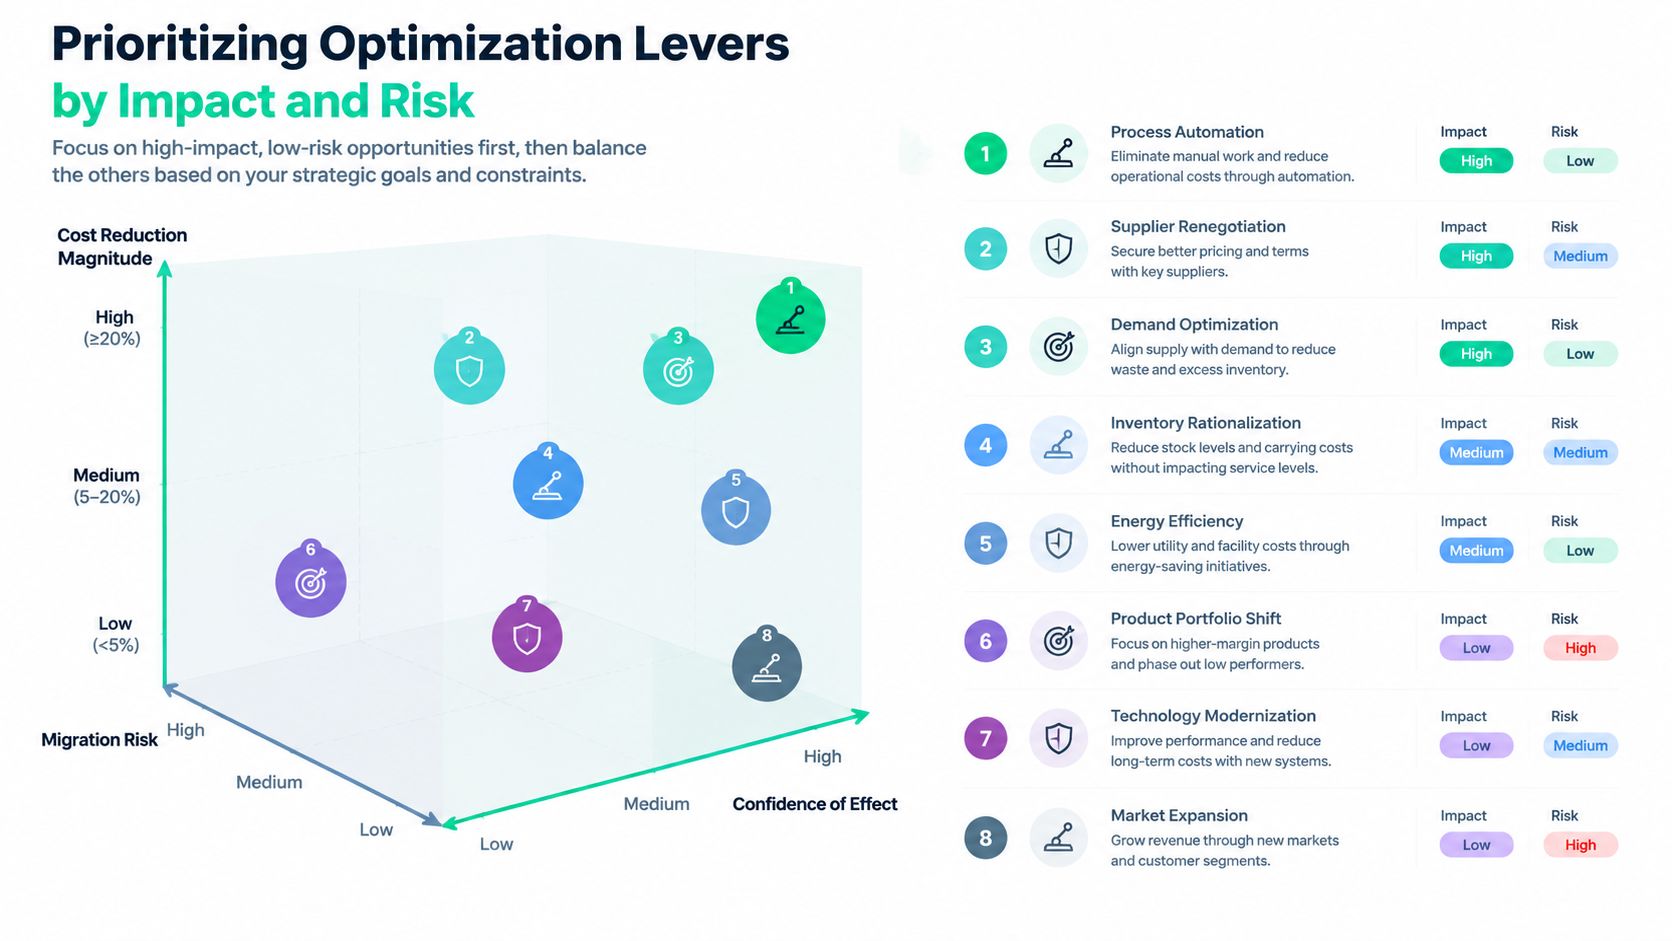
Sequence work by evidence
Prompt and template trimming usually comes first. It changes the workload without changing the model and is often easy to validate through token counts and regression tests. Remove duplicated instructions, obsolete examples, unused tool fields, and unnecessary history.
Caching follows when reuse is real. OpenAI and Anthropic both require at least 1,024 tokens for cached-input billing, while Anthropic's Haiku tier requires 2,048 tokens (OpenAI and Anthropic prompt caching). Short prompts may not qualify, but large reusable templates and documentation blocks can.
Routing comes after workload classification. Send simple extraction or classification requests to a lower-cost model only after representative evaluations show that quality remains inside the service-level target. Keep escalation available for ambiguous or high-risk cases.
Distillation and aggressive model changes come last. They can produce substantial savings, but they carry more migration risk and require a maintained evaluation set.
The framework should distinguish large reductions from incremental gains. A high-impact, high-confidence prompt problem deserves attention before a low-confidence model experiment. A proposed 40% to 60% reduction or 5% to 10% incremental saving should be treated as a test hypothesis, not a guaranteed result, unless the team has workload-specific evidence.
Before shipping a switch, require safety tests, quality regression tests, latency checks, retry analysis, and rollback controls. The invoice is only one acceptance criterion.
Forecasting, Chargeback, and the Questions Leaders Ask First
A credible AI token cost forecast starts with observed requests, not a top-down budget. Group monthly traffic by workload and model tier, then calculate average fresh input, cached input, and output tokens for each group. Apply the effective provider rate to those distributions.
Adjust the baseline for traffic, model mix, and planned releases. A feature that lengthens prompts or changes output behavior should carry an explicit cost assumption. The same headline rate can produce very different invoices when workloads differ in cache reuse, output length, retry frequency, and routing. Provider and model prices also vary widely, so a single blended rate can hide exposure to model-mix changes.
Make ownership visible
Chargeback depends on stable request tags. Each call should map to a tenant, product line, cost center, or internal owner. Finance can assign provider charges to the P&L line receiving the benefit, while engineering can trace a spike to the endpoint, deployment, or workload that caused it.
| Question | Short Answer | Where to Look |
|---|---|---|
| How should we set a per-request budget? | Base it on outcome economics and observed request distributions. Review exceptions instead of enforcing one blunt ceiling. | Request telemetry, margin model, and product owner review |
| When do committed-use discounts pay off? | When usage is stable enough that the expected workload will not fall below the commitment. | Historical provider usage and release forecast |
| How should we alert on overruns? | Monitor rate changes, token mix, cache misses, retries, and endpoint anomalies before applying throttles. | Daily spend, workload tags, and deployment timeline |
| What should leaders review? | Cost per active user, ticket, document, or successful workflow. | Finance dashboard joined to product outcomes |
| What belongs in the operating checklist? | Reconcile invoices, inspect top drivers, review cache efficiency, test model alternatives, and assign owners. | Weekly FinOps and engineering review |
A useful alert explains why spend changed. It should distinguish expanded prompts from a routing change, falling cache hits, higher retry volume, or unusual demand from one tenant. Progressive controls are safer than immediate shutdowns because a high-value workflow may legitimately generate high usage. Set separate thresholds for spend, quality, latency, and failure rates so a cost response does not conceal a service problem.
Review the system weekly. Produce three decisions: identify the largest cost driver, select the most credible savings experiment, and name the owner responsible for validating it. Measure the experiment against workload outcomes, not only token volume. That process turns an invoice surprise into a managed unit-economics system.
SpendLens AI instruments OpenAI and Anthropic calls, attributes usage by workload, separates fresh, output, and cached tokens, and ranks model-switch opportunities by estimated savings, confidence, and migration risk. Visit SpendLens AI to connect request telemetry with the cost and chargeback decisions described here.