
What Is Unit Economics and Why It Matters for AI Products
Learn what is unit economics, why it matters for SaaS and AI products, and how to measure and improve per-feature profitability with practical examples.
Your product team ships an AI assistant, sees usage climb, and celebrates the signup chart. Then Finance asks why the model invoice is growing faster than subscription revenue. The product dashboard shows active users, conversations, and retention, but it can't answer the questions that determine whether the feature is commercially sound: Which workflow makes money? Which customer segment is subsidizing another? What does one successful AI response cost after retries, retrieval, caching, and tool calls?
That gap is exactly what unit economics addresses. It measures revenue and direct cost at the smallest useful level, then connects that unit to customer acquisition, retention, pricing, and cash recovery. For traditional SaaS, the unit might be a customer or subscription seat. For an AI product, it may also be a feature execution, workflow, token bundle, or successful inference call.
Table of Contents
- The Bill That Outgrew the Product
- Defining the Unit in a Subscription and an Inference Economy
- CAC, LTV, and the Math That Decides Whether Growth Pays for Itself
- Contribution Margin vs Gross Margin for Variable AI Costs
- Per-Inference Cost, Per-Feature Margin, and Break-Even Analysis
- How One Team Cut Its LLM Unit Cost in Half Without Hurting Quality
- Building a Daily Unit Economics Practice with SpendLens AI
The Bill That Outgrew the Product
The assistant is popular, yet the invoice is growing faster than the business. In a mid-market SaaS team's hypothetical Q1-to-Q2 scenario, signups double, the OpenAI bill triples, and revenue grows only 40%. Usage has increased. Its economic value remains unproven.
The product lead reviews the dashboards. They show signups, daily active users, chat volume, and average session length, but none connects usage with a customer plan, feature, or fully loaded delivery cost. A heavy user on the entry tier appears identical to a profitable enterprise account.
The operational question: More usage is good only when its revenue and strategic value justify its variable cost.
Three questions expose the gap:
- Feature profitability: Does document summarization generate enough revenue to cover model, retrieval, storage, and support costs?
- Plan economics: Is the new AI tier profitable, or is the legacy subscription subsidizing it?
- Inference economics: What does one completed chat reply cost after retries, tool calls, retrieval, and failed requests?
A company-level P&L can show whether the business is profitable overall, while hiding the unit where the leak begins. A customer view can identify a valuable account, while missing an expensive feature that account uses heavily. A model invoice can show provider spend, but not which tenant or workflow caused it.
Unit economics connects these layers. It measures the relationship among one customer, one feature, one transaction, and one inference, much like tracing a household budget from total spending down to the cost of one meal. The framework became prominent during the internet and startup era because companies needed to show that each unit created more value than it consumed, as described in this overview of unit economics in SaaS.
For an AI product team, the aim is not a finance model reviewed once a quarter. It is an operating loop: identify the unit, assign revenue and variable cost, compare contribution, find the cost driver, and change the product or infrastructure before the next invoice arrives. That same discipline carries from customer-level CAC and LTV down to tokens, tool calls, and individual feature executions.
Defining the Unit in a Subscription and an Inference Economy
A unit is the smallest transaction whose revenue and direct cost you can isolate consistently. For a subscription business, that may be one seat per month. For an AI feature, it may be one successful summary call.
Start with three simple measures:
- Revenue per unit = revenue assigned to the unit.
- Cost per unit = fully loaded variable cost required to deliver the unit.
- Contribution per unit = revenue per unit minus variable cost per unit.
The arithmetic doesn't change when the unit changes. Only the measurement boundary changes.
Suppose a SaaS seat sells for $29 per month and incurs $4 in support and payment-processing cost. Its monthly contribution is $25, before fixed engineering, sales, and general overhead. Now consider a summarization feature that charges $0.05 per summary and consumes $0.018 in inference tokens, retrieval calls, and vector storage per run. Its contribution per call is $0.032.
The two examples answer different business questions. The seat tells you whether the subscription can support customer acquisition and retention. The summary call tells you whether usage within that subscription is economically safe.
For a practical explanation of the request-response lifecycle behind that second unit, see this guide to LLM inference.
| Metric | SaaS Seat ($29/mo) | LLM Summary Call |
|---|---|---|
| Revenue per unit | $29.00 per month | $0.05 per summary |
| Variable cost per unit | $4.00 | $0.018 |
| Contribution per unit | $25.00 | $0.032 |
| Unit boundary | One active seat | One successful summary |
| Main diagnostic | Retention and support burden | Tokens, retrieval, retries, and storage |
The most useful model stacks the units rather than choosing only one. At the customer layer, assign subscription revenue, CAC, retention, and plan-level service costs. At the feature layer, assign feature revenue or an allocated share of subscription value. At the inference layer, assign provider and infrastructure costs to each successful workload.
That stack exposes the source of a loss. A customer may be profitable overall, while a feature is negative on contribution. A feature may be healthy on average, while one prompt version or tenant creates excessive token consumption. The unit should be small enough to reveal the decision, but stable enough to measure every day.
CAC, LTV, and the Math That Decides Whether Growth Pays for Itself
A product team can report healthy customer economics while an AI feature consumes the margin. Customer-level unit economics identifies what acquisition and retention must earn. Feature and inference economics show whether each workflow helps or hurts that result.
Customer Acquisition Cost, or CAC, is fully loaded sales and marketing spend divided by new customers acquired. Lifetime Value, or LTV, estimates the gross profit generated throughout the customer relationship, rather than revenue alone.
A practical operating model is:
- CAC = fully loaded acquisition spend ÷ new customers acquired
- LTV = recurring revenue per customer × gross margin ÷ churn
- LTV:CAC = LTV ÷ CAC
- Payback period = CAC ÷ monthly contribution or gross profit per customer
A widely cited SaaS benchmark uses an LTV:CAC ratio of 3:1, or about $3 of lifetime gross profit for every $1 spent acquiring a customer, as explained in this unit economics framework. SaaS practitioners often regard 5:1 or higher as excellent, while a ratio below 3:1 generally means acquisition costs are high compared with the gross profit produced, according to this SaaS unit economics guide.
For example, hypothetically, a customer with an LTV of $400 and CAC of $100 has a 4:1 ratio. If that customer generates $25 in monthly contribution, the acquisition cost takes four months to recover. Those figures are illustrative. The picture changes when an AI tier loses $2 per active user.
Blended LTV can still appear to be $400 because profitable legacy usage offsets the new feature's cost. The AI tier has changed the cost structure, but the company has not separated its cohorts or features. A healthy blended ratio can therefore hide a weak product decision.
Separate the layers before judging growth
Break the model down by plan, acquisition channel, customer cohort, and AI feature. Track:
- Revenue and discounting by plan
- Gross margin after direct delivery costs
- AI usage and contribution by feature
- Churn or retention behavior
- CAC and payback for the relevant acquisition cohort
Calculate LTV for the AI tier separately from the legacy tier. Lower retention, higher support needs, or negative feature contribution should remain visible instead of being averaged into the broader customer result.
Practical rule: A blended LTV:CAC ratio is a summary, not a diagnosis. Segment it until a product owner can identify the action that would improve it.
Payback matters because inference usage creates cash costs before the company receives the full customer lifetime value. Growth funds itself only when customer contribution recovers CAC within the period that usage costs, revenue collection, and retention dynamics allow. Applying the same discipline at the inference call makes the diagnosis more precise: connect provider cost to tokens and feature usage, then roll those results up into customer LTV.
Contribution Margin vs Gross Margin for Variable AI Costs
Gross margin measures the revenue left after cost of goods sold. A common formula is Gross Margin = (Revenue − COGS) ÷ Revenue, as outlined in this unit economics reference. The exact classification of infrastructure can vary, but gross margin usually provides a broad view of direct delivery economics.
Contribution margin is narrower and more operational. It subtracts the variable costs directly caused by one unit, such as tokens, embedding generation, retrieval, vector database access, usage-linked support, and payment fees. The formula is Contribution Margin = (Revenue − variable costs) ÷ Revenue, as described in this contribution margin guide.
For AI features, contribution margin is often the sharper decision lens. Engineering salaries and baseline infrastructure may not change when one more customer runs a workflow. Inference tokens and retrieval calls do change. If those costs rise with every request, the feature needs enough per-request contribution to absorb fixed R&D and overhead.
Imagine a chatbot conversation priced at $0.02. A gross-margin view reports 72% after fixed costs are included in the team's chosen accounting view. Once token, embedding, and vector database costs are isolated as variable consumption, contribution margin falls to 38%. The feature may look acceptable on a company dashboard while leaving too little cash contribution per conversation.
| Line Item | Gross Margin View | Contribution Margin View |
|---|---|---|
| Revenue | Chat feature revenue | Chat feature revenue |
| Infrastructure | Includes the selected COGS allocation | Includes usage-linked infrastructure only |
| Model tokens | Included within broad delivery cost | Explicit variable cost per conversation |
| Embeddings and vector DB | May be blended into infrastructure | Isolated when caused by the request |
| Decision use | Product and company reporting | Pricing, limits, routing, and feature gates |
This distinction changes product decisions. A team may keep the feature but limit expensive context, route simple requests to a cheaper model, or reserve high-cost capabilities for a premium plan. It may also revise pricing so the customer pays for the value and the consumption pattern.
For allocation design, connect provider charges and shared infrastructure to a stable business dimension instead of spreading them evenly. A practical starting point is this guide to cost allocation methods.
The key is consistency. If retrieval is counted as variable cost in one week but treated as fixed infrastructure the next, the margin trend becomes an accounting artifact rather than an operating signal.
Per-Inference Cost, Per-Feature Margin, and Break-Even Analysis
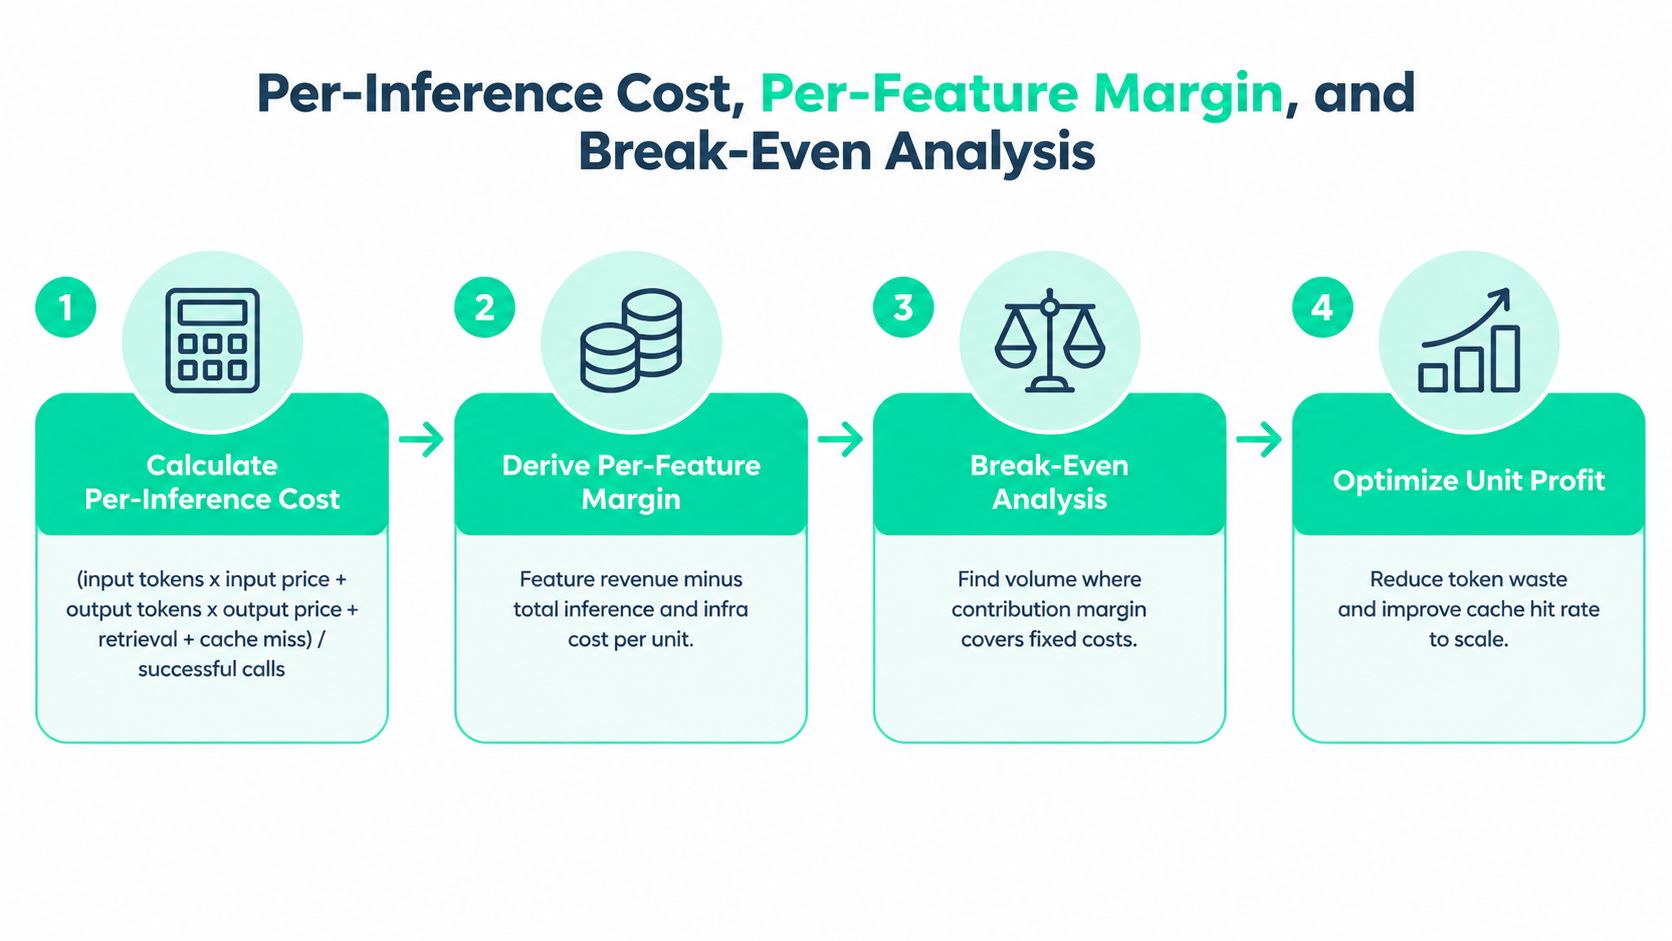
A feature can gain users while each request loses money. Per-inference economics exposes that gap by converting a provider invoice into a cost for one successful call:
Per-inference cost = (input tokens × input price + output tokens × output price + retrieval cost + cache-miss cost) ÷ successful calls
Keep failed calls and retries in a separate view. They consume tokens and infrastructure without necessarily creating billable customer value, so hiding them inside successful calls understates the workload cost.
Consider a summarization call using GPT-4o-mini with illustrative pricing of $3 per million input tokens and $15 per million output tokens, alongside $0.0004 for retrieval. The token prices should be checked against the provider's current GPT-4o-mini pricing. The calculation is:
- Input cost: 1,200 × $3 ÷ 1,000,000 = $0.0036
- Output cost: 400 × $15 ÷ 1,000,000 = $0.006
- Retrieval cost: $0.0004
- Listed total before discounts: $0.010
The supplied feature model uses an effective call cost of $0.0068, against a $0.02 charge, producing a 66% feature gross margin. The difference is explained by cached-token discounts applied to the listed token calculation. Reconcile the price card, cached-token treatment, retrieval charge, and denominator before publishing the metric. A unit economics model only supports decisions when another person can trace its inputs and reproduce its result.
Turn margin into a break-even decision
Once contribution per inference is known, calculate the required volume:
Break-even calls = monthly fixed AI overhead ÷ contribution per inference
Fixed AI overhead can include baseline serving, monitoring, or dedicated platform capacity. Divide that amount by the contribution from each successful call, while keeping fixed overhead separate from variable inference cost. The split shows whether the problem is insufficient volume, pricing, or delivery cost.
Positive contribution does not mean a feature covers its fixed costs immediately. It may require substantial adoption. A feature with negative contribution cannot repair its break-even position through volume alone, because every additional call increases the variable loss.
For a workflow that connects usage assumptions with infrastructure spend, use this AI cost estimation resource.
Before trusting a weekly number, verify five fields:
- Feature ID: Revenue and cost events use the same identifier.
- Workflow ID: Summarization, chat, extraction, and tool use remain distinguishable.
- Model and version: Model changes and prompt releases produce comparable cohorts.
- Tenant or plan: Heavy usage remains visible instead of disappearing inside an average.
- Outcome status: Successful, failed, retried, and cached calls are classified separately.
The result is a margin view a product manager can challenge and an engineer can reproduce from raw events.
How One Team Cut Its LLM Unit Cost in Half Without Hurting Quality
A B2B document-analysis product saw its inference bill grow faster than its seat base. In this anonymized example, the team spent six weeks replacing a provider-level view with call-level attribution. Each request carried a feature, tenant, and prompt-version identifier, so the team could inspect the economics of a feature and an individual inference call rather than accept one blended invoice.
The tagging exposed avoidable work. A large share of tokens came from a verbose system prompt, so the team shortened it. The team also found requests sent to a flagship model even when a mid-tier model handled the same task at much lower cost, with no measured quality regression in its evaluation set.
The comparison had to be fair. The team held the task, prompt version, and evaluation criteria steady, much like comparing two production lines that receive the same materials. Otherwise, a cheaper model could appear better just because it received easier requests.
The optimization loop
The team made three changes:
- Prompt reduction: Repeated instructions and unnecessary context were removed from the system prompt.
- Model routing: After evaluation, most eligible traffic moved to the mid-tier model.
- Output control: The application capped output tokens and added prompt caching for repeated clauses.
The anonymized example reported per-call cost falling from $0.0094 to $0.0046 and feature contribution margin rising from 31% to 58%. Payback on the optimization work was under two weeks. These figures describe the example's measured outcome, not a universal benchmark. The same tagging system also reduced invoice investigation from an open-ended search to a ranked list of workloads, saving engineering attention as well as money.
Engineering lesson: Optimize the workload before optimizing the provider relationship. A model change cannot compensate for an oversized prompt, uncontrolled output, or missing attribution.
Quality controls remained in place. The team did not route every request blindly or treat a dashboard average as proof. It compared the candidate model against a fixed evaluation set, monitored production outcomes, and retained the flagship model for requests that failed routing criteria.
The workflow reflects practical token cost optimization. Savings came from matching model capability, prompt size, and output length to each job. The result was lower spending per successful call and clearer evidence about which feature behavior needed attention.
Building a Daily Unit Economics Practice with SpendLens AI
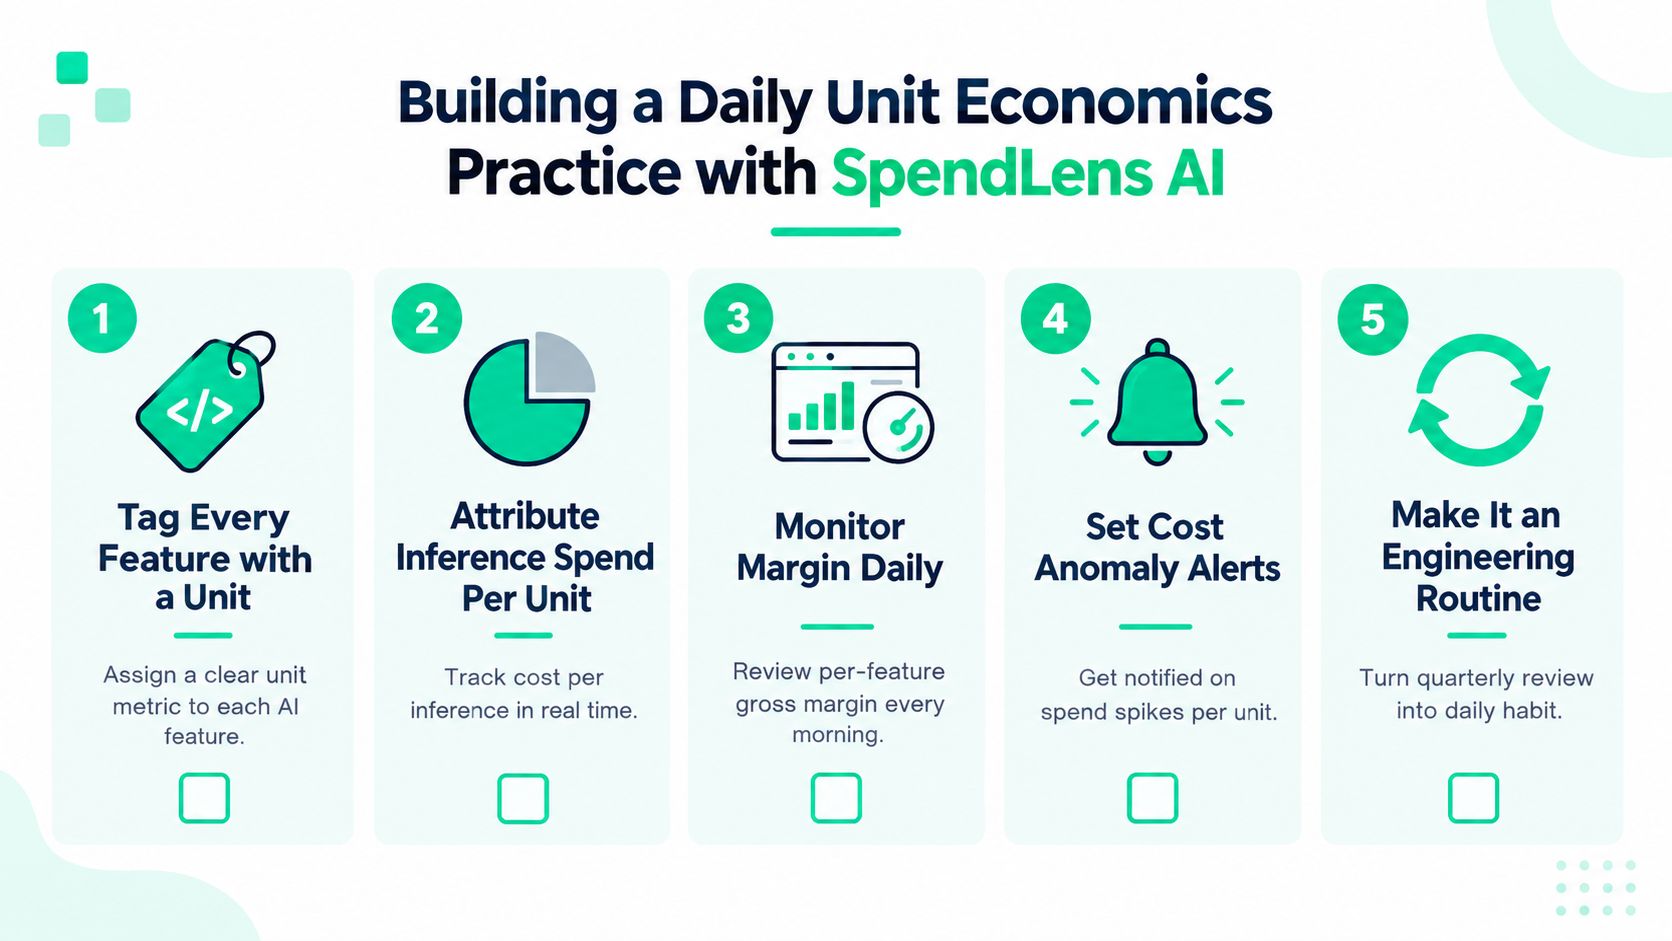
Unit economics becomes useful when it changes what the team does today, not just what Finance reports after the quarter closes. Five habits create that operating rhythm.
Give every feature a measurable unit
A product manager should define whether the unit is a successful summary, extracted document, workflow completion, or active seat. The definition needs a revenue field, a variable-cost field, and an owner.
Attribute spend at workload level
Provider, cloud, and vector-store costs should map to the same feature and workflow identifiers. SpendLens AI can ingest usage across cloud, model, and vector-store workloads, then break costs down by project, provider, model, and workload.
Review margin against a target band
A daily dashboard should show contribution or gross margin by feature, not only total AI spend. A cost-per-unit alert is more actionable than an invoice alert because it tells the owner which behavior changed.
Run break-even checks against the plan
Compare actual call volume, contribution per call, and fixed AI overhead with the operating plan. If a prompt release increases tokens or a model change lowers margin, update the forecast before pricing and capacity decisions harden.
Route recommendations through one accountable loop
A recommendation needs an owner, a test, an expected outcome, and a review date. SpendLens AI provides workload-level cost tracking, per-feature margin views, cost-per-unit anomaly and drift alerts, model and prompt recommendations with projected margin impact, and Slack-based review workflows. Teams can use those signals to prioritize an experiment instead of asking engineers to search several provider consoles.
The daily practice should remain lightweight. Instrument the existing provider clients, preserve retries and configuration, tag the workload, and review the highest-impact recommendation. Over time, the team builds a history of feature margin, model behavior, prompt changes, and savings decisions instead of relying on a heroic quarterly reconciliation.
The payoff is measurable: less time tracing invoices, less money spent on avoidable tokens, faster detection of regressions, and clearer pricing decisions. The team can defend not only what AI costs, but which customer value each unit creates.
SpendLens AI connects LLM spend to features, workflows, models, tenants, and per-call usage so product and FinOps teams can measure AI unit economics without rebuilding their provider clients. Visit SpendLens AI to instrument a workload, find its highest-cost drivers, and turn the next optimization into a tracked margin improvement.