
What Is Pricing Analytics: A 2026 Guide for LLM Costs
Learn what is pricing analytics and how applying its principles to LLM costs can save you money. Turn opaque AI bills into actionable savings.
The invoice arrives before the explanation does. Finance sees an unexpected jump in OpenAI or Anthropic charges, engineering starts searching deployment logs, and product owners ask whether a new feature, customer, prompt change, or experiment caused the increase. Everyone has a number, but nobody has a reliable answer to the more important question: what created the cost, and was that spend worth it?
That's the operational problem behind what is pricing analytics. It isn't merely a report of historical prices. It's a discipline for connecting demand, cost, value, and decisions. For LLM products, that discipline must account for tokens, model selection, workload behavior, and constantly changing usage patterns.
Table of Contents
- The Surprise AI Bill Nobody Can Explain
- From Price Tags to Profit Levers
- Why Pricing Analytics for AI Is Radically Different
- Pricing Analytics in Action with Real-World Examples
- Turning LLM Spend Data into Action with SpendLens AI
- From Cost Center to Competitive Advantage
The Surprise AI Bill Nobody Can Explain
A team ships an AI search feature. Usage looks healthy, latency stays within expectations, and the dashboard shows successful requests. At the end of the billing period, the invoice is several times larger than the forecast. The engineering lead asks which endpoint caused the spike. Finance wants a customer-level allocation. The product manager wants to know whether the feature generated enough value to justify the spend.
A conventional cloud or SaaS budget report often shows the provider total, perhaps grouped by account or environment. That's useful for reconciliation, but it won't tell you whether a long prompt template, repeated context, an expensive model assigned to a simple classification task, or a single high-volume workflow drove the increase. Without workload-level attribution, the investigation starts after the money has already left the account.

Why budget tracking misses the cause
Traditional financial controls usually track an account, department, or vendor. LLM consumption adds another layer. The same provider account can serve customer support, document extraction, internal copilots, evaluation jobs, and production recommendations, each with different business value and cost behavior.
A deployment can also change spending without changing the request count. A prompt may include more context, responses may become longer, or a routing rule may send more work to a higher-cost model. A monthly invoice records the financial outcome, but not the engineering decision that produced it.
Practical rule: If your cost report can't identify the workload, owner, model, and feature behind a charge, it isn't yet a pricing analytics system.
The broader market reflects how important this capability has become. The global price optimization software market is projected to grow from USD 1.95 billion in 2026 to USD 4.17 billion by 2031, according to Mordor Intelligence's price optimization software market analysis. That expansion signals a shift from periodic reporting toward systems that support frequent commercial decisions.
Start with a traceable cost question
The first useful question isn't “How do we reduce our AI bill?” It's “Which decision, workload, or customer behavior produced this spend?” From there, teams can examine whether the cost came from legitimate growth, inefficient prompts, poor model-task fit, duplicate processing, or a feature whose value remains unproven.
A focused cost anomaly detection workflow can help surface unusual changes earlier, but detection is only the beginning. Pricing analytics connects the anomaly to an owner and an action, such as testing a smaller model, shortening context, changing cache behavior, or revising the product workflow.
The expected outcome is measurable in operational terms. You might save engineering investigation time, avoid waste on repeated prompts, or prevent a costly deployment from becoming the next billing surprise. The exact value depends on your workload, but the principle is consistent: visibility creates the possibility of controlled savings.
From Price Tags to Profit Levers
A supermarket manager doesn't price every product by looking at the supplier invoice alone. They consider how quickly an item sells, how customers respond to price changes, what nearby competitors charge, how much inventory remains, and whether a promotion will increase total basket value. Pricing analytics brings those signals together so the manager can choose an action rather than merely describe yesterday's sales.
The same logic applies to software and AI. A price is useful only when connected to usage and value. For an LLM feature, the equivalent of a shelf price is the provider's token rate. The equivalent of demand is workload volume. The equivalent of margin is the business value created after inference costs, latency, reliability, and customer outcomes are considered.
The three operating questions
Academic research organizes pricing analytics around demand learning and estimation, optimization and pricing decision techniques, and strategic interaction and market response frameworks, as described in this technical review of pricing analytics. In practice, those pillars become three operating questions.
What is being used, by whom, and under which conditions?
Demand learning starts with behavior. In retail, that may mean units sold by product, channel, time, and customer segment. In LLM operations, it means calls by feature, endpoint, workflow, model, environment, and release. A support assistant and an offline evaluation job may use similar prompts, but they shouldn't be treated as the same economic workload.What does each action cost?
Cost attribution links consumption to a meaningful owner. For AI, that includes input tokens, output tokens, model choice, provider, cache behavior where available, and the application context that generated the request. A provider invoice can tell you what was billed. Instrumentation can tell you which product decision caused the bill.What should change next?
Optimization turns evidence into a recommendation. The answer might be a lower-cost model, a shorter template, a different context strategy, a revised batch process, or no change at all. The right decision isn't always the cheapest option. It's the option that protects the required quality and reliability while improving the economics.
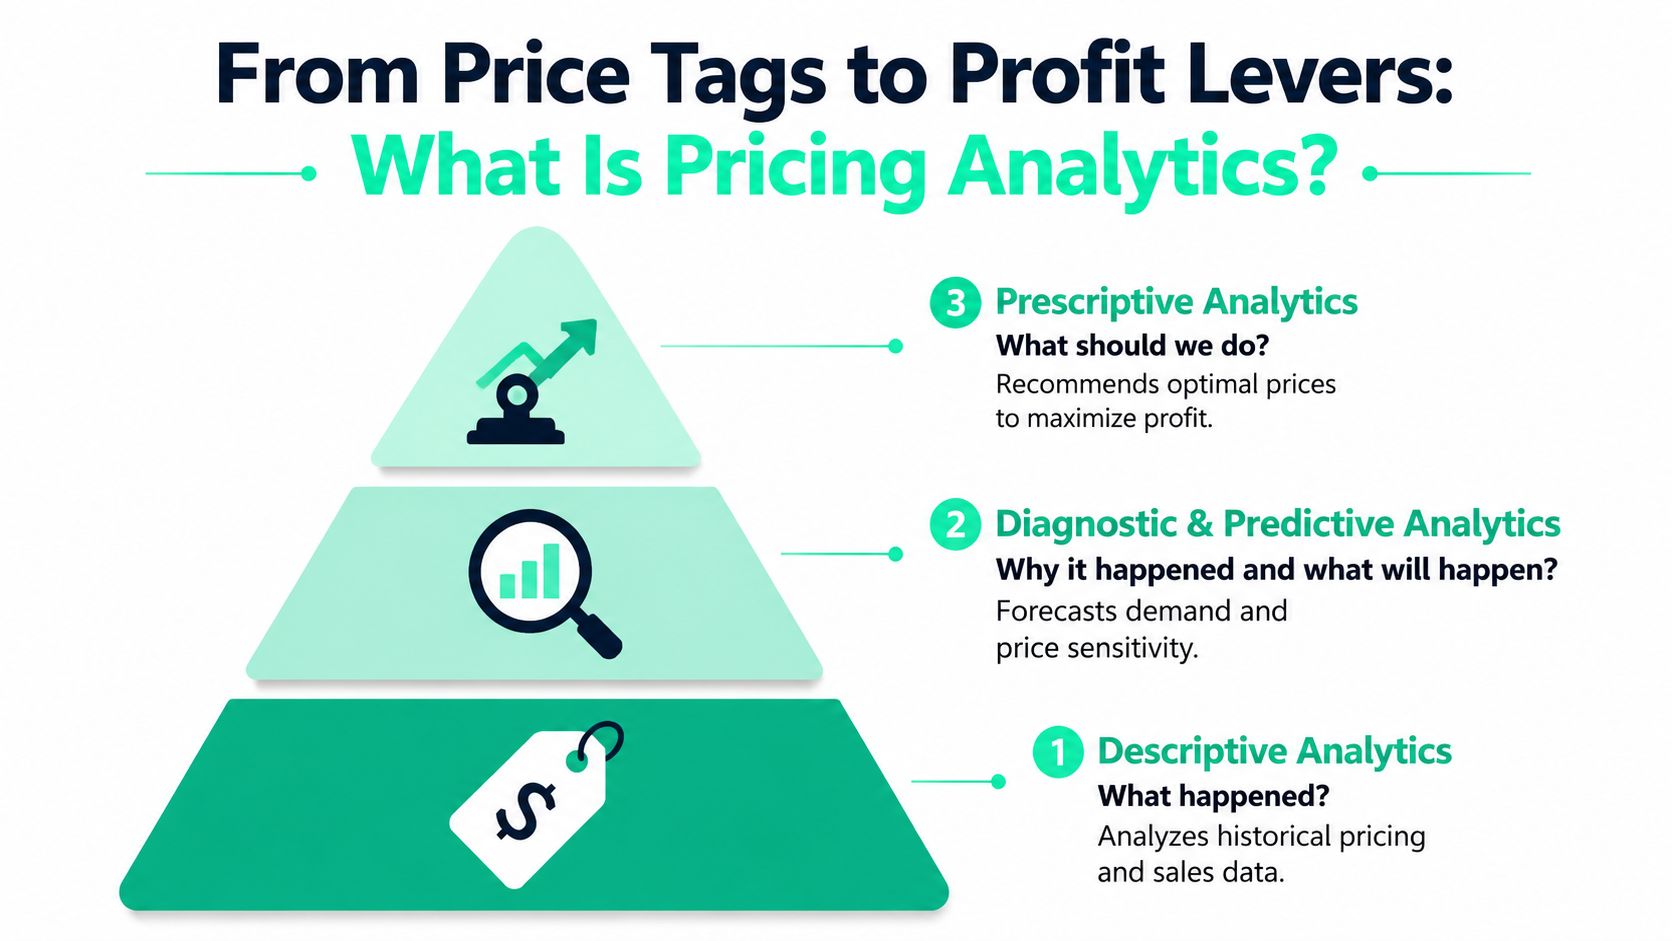
Descriptive dashboards answer what happened. Diagnostic analysis investigates why it happened. Predictive models estimate what might happen under different conditions. Prescriptive analytics recommends an action, such as adjusting a price, changing a markdown, or moving a workload to a more suitable model.
That progression matters because a dashboard alone doesn't reduce spend. A team saves money when someone can act on a trustworthy recommendation, test the change, and verify the result.
Apply the model to LLM economics
For an AI product, start by defining the unit of analysis. It could be a resolved support ticket, a generated document, a completed workflow, or an active customer session. Then calculate the inference cost associated with that unit and compare it with an outcome that matters, such as completion quality, conversion, retention, or human review time.
A practical AI FinOps operating model treats those measurements as part of normal engineering and financial operations. That approach saves time because teams don't need to reconstruct usage manually at the end of the month. It also improves accountability, since product and engineering owners can discuss cost alongside reliability and user value.
The important distinction is simple: pricing analytics isn't a prettier invoice. It's a feedback loop that connects observed demand and cost to the next decision.
Why Pricing Analytics for AI Is Radically Different
A per-seat SaaS product is comparatively easy to forecast. A team buys seats, assigns them to users, and monitors adoption. Retail pricing has more complexity, but the analyst can still reason about products, transactions, promotions, inventory, and observed price response.
LLM consumption behaves differently. A single user action can generate different costs depending on the prompt length, retrieved context, output length, selected model, provider, caching behavior, retries, and orchestration path. Two requests that look identical in a product analytics dashboard may have materially different inference costs.
The comparison teams need
| Factor | Traditional Analytics, such as SaaS or retail | LLM Pricing Analytics |
|---|---|---|
| Primary unit | Seat, product, order, or transaction | Request, token, workflow, feature, or completed task |
| Cost behavior | Often relatively stable per unit | Changes with input, output, model, provider, and workload behavior |
| Demand signal | Purchases, renewals, usage, or promotion response | Calls, token volume, task mix, routing, retries, and user behavior |
| Optimization action | Adjust price, promotion, assortment, or packaging | Switch model, reduce prompt waste, improve caching, alter routing, or redesign a workflow |
| Quality constraint | Availability, conversion, margin, and customer response | Accuracy, latency, reliability, safety, and task completion |
| Main reporting risk | Missing price sensitivity or promotion effects | Losing attribution between provider charges and business workloads |
An invoice grouped by provider can't answer whether a model was appropriate for a task. A request count can't reveal that a prompt became larger after a release. A token total can't explain whether the output improved the customer experience enough to justify its cost.
The right comparison is therefore not “cheap model versus expensive model.” It's cost per acceptable outcome. A smaller model that fails a critical task can create rework and human review. A premium model used for a simple task can waste budget. Pricing analytics must expose that trade-off rather than hide it behind an average cost.
Automation must end at a governed decision
McKinsey reports that Gen AI is already used in 10–30% of pricing activities, while automated execution remains a separate challenge, as described in its analysis of AI's role in B2B pricing. The implication for LLM costs is practical. Generating a recommendation is easier than deciding when the system may apply it automatically.
Safe automation usually starts with low-risk actions. A system can flag prompt bloat, group similar workloads, estimate the effect of a model change, or open a review task without changing production traffic. More consequential actions, such as routing customer-facing requests to a different model, should pass through testing, quality thresholds, ownership, and rollback controls.
Teams exploring LLM inference fundamentals should connect technical behavior to financial measurement. Track the cost of a task, not just the provider total. Record the quality outcome. Then evaluate whether a recommendation produces a real improvement in spend per successful result.
Pricing Analytics in Action with Real-World Examples
The value becomes clearer when the recommendation creates a visible financial outcome.
A European discount-store chain used markdown price optimization for clothing. The final recommended price was about 20% higher than the actual markdown prices for most items, sales units fell by around 6%, and revenue in the clothing category increased by 10%, according to the published case on markdown optimization.
That example challenges a common misconception. More units sold doesn't automatically mean better performance. The model balanced price, demand, and inventory constraints. It accepted lower unit volume because the resulting price and sales mix produced higher total revenue while still meeting clearance requirements.
The winning price is not always the price that maximizes volume. It's the price that best satisfies the business constraint.
The same logic applies to model selection
Consider an AI product team reviewing a sentiment-analysis workflow. The workload uses a high-cost general-purpose model even though the task has a narrow input format, a limited output requirement, and a quality threshold that a lower-cost alternative may satisfy.
Pricing analytics would isolate that workflow rather than average it into the company-wide bill. The team would compare model cost, response quality, latency, retry behavior, and human review. If the lower-cost option passes the required evaluation, the change can be tested on that workload without forcing a provider-wide migration.
The financial result should be expressed in operational terms, such as monthly spend avoided, cost per completed analysis, and engineering time required to validate the change. Don't claim savings before measuring the baseline and running the comparison. A recommendation is a hypothesis until production evidence confirms that quality and reliability remain acceptable.
Optimization can lower prices and improve profit
Dynamic pricing isn't limited to raising prices. An academic study of algorithmic pricing associated one period with a 5% decrease in average transaction prices, an 8.3% fall in prices from Monday through Thursday, and a 2.8% reduction in variable production costs, resulting in a 1.1% increase in variable profits, according to this study of dynamic pricing, intertemporal spillovers, and efficiency.
The lesson for LLM teams is equally important. Cost optimization can involve spending less per request, but it can also involve improving throughput, reducing redundant work, increasing cache efficiency, or matching model capability to task complexity. The objective is better economic performance, not an arbitrary reduction in the invoice.
Turning LLM Spend Data into Action with SpendLens AI
Teams don't lack interest in AI cost control. They lack instrumentation that connects provider activity to application behavior. Engineers can inspect logs, finance can download invoices, and product managers can review usage metrics, but those sources rarely share a common workload identity.
Simon-Kucher's Global Pricing Study 2025 identifies disconnected tools and manual workflows as barriers to acting on pricing data, while 54% of companies not using AI cite a lack of in-house expertise or resources as a barrier, according to the Global Pricing Study 2025. For LLM operations, a purpose-built layer can reduce the amount of custom analysis required before a team reaches its first actionable finding.
Instrument the decision, not just the API call
SpendLens AI provides developer-first tracking for OpenAI and Anthropic workloads. A Python team can add lightweight observation and optional tags to associate calls with workflows, tasks, features, experiments, or endpoints, while preserving the existing provider client configuration.
That attribution changes the investigation. Instead of asking why the provider total rose, a team can ask which feature, project, model, provider, or workload created the increase. The dashboard can organize token usage, cache efficiency, and per-call metrics where available, giving engineering and finance a shared view of consumption.
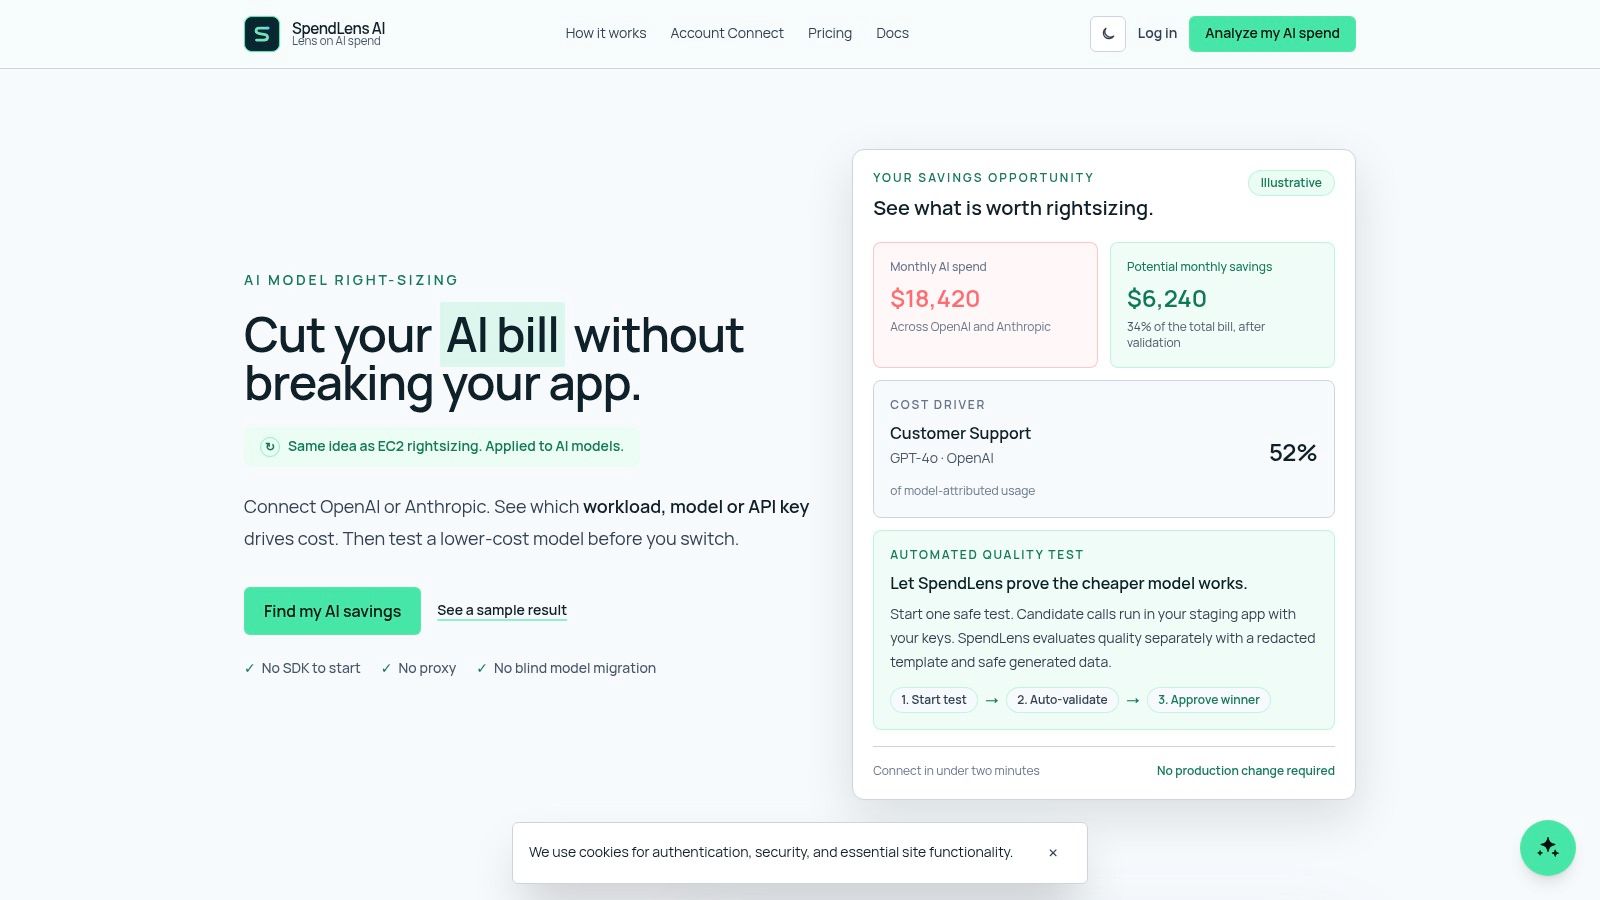
The platform doesn't sit in the LLM request path. Calls continue directly to providers, which avoids introducing routing behavior or an additional proxy dependency. Its privacy-aware defaults use metadata-only tracking, template-only prompt sampling, and hashed API keys, while user prompts and model responses aren't stored by default.
Turn a bill into a prioritized queue
A useful analytics system should make the next action obvious. SpendLens AI groups similar operations for apples-to-apples comparisons across environments and releases, then surfaces potential model-switch opportunities, prompt waste signals, and cache-related inefficiencies where provider data supports them.
A practical review might look like this:
- Find the largest driver: Identify the workload or feature responsible for the most spend.
- Check task fit: Compare the current model with alternatives against quality, latency, and failure behavior.
- Inspect prompt waste: Look for excessive context, repeated instructions, large templates, or unnecessarily long outputs.
- Estimate the opportunity: Review projected monthly savings alongside confidence and migration risk.
- Run a controlled test: Validate the recommendation on representative traffic before changing production routing.
- Verify the result: Compare spend per successful task, quality, and operational reliability after the change.
The value isn't limited to dollars. A daily summary showing yesterday's spend, the top cost driver, and the highest-impact recommendation can reduce the time leaders spend assembling updates from separate systems. A prioritized queue also prevents engineers from chasing small optimizations while a single workload consumes most of the budget.
Teams can start with a small service rather than instrumenting an entire platform. The SpendLens AI implementation guide describes the setup path, while the operating discipline remains the same regardless of the tool: define ownership, measure a baseline, test a change, and confirm the result.
From Cost Center to Competitive Advantage
Pricing analytics changes the conversation from “Why is the bill high?” to “Which AI work creates value, and what does that work cost?” That shift matters because aggressive cost cutting can damage quality, while unmanaged experimentation can make successful products economically fragile.
A mature team treats LLM spend as a product metric alongside latency, reliability, and user outcomes. It knows which workflows consume the most budget, which model is appropriate for each task, where prompts create avoidable token volume, and how much a proposed change could save before engineers invest in migration work.
The strategic advantage comes from making those decisions earlier. Teams with workload-level visibility can approve valuable AI features with more confidence because they understand the economic boundary. They can also remove waste without applying blunt limits across every customer or feature.
Three principles anchor the practice:
- Measure at the workload level: Provider totals are accounting data, not sufficient operating data.
- Optimize for completed outcomes: The lowest token cost isn't useful if quality failures create rework.
- Create a closed loop: Every recommendation needs an owner, a test, and a post-change measurement.
The result is a more predictable budget and better allocation of engineering attention. Money saved through model switching, prompt cleanup, or cache improvements can fund higher-value experiments. Time saved through automatic attribution and daily prioritization can return engineers to product work.
Pricing analytics is therefore more than a pricing function. For LLM businesses, it's a control system for deciding where AI should run, how much it should cost, and whether the result justifies the investment.
SpendLens AI gives engineering and FinOps teams workload-level visibility into OpenAI and Anthropic spend, including cost drivers, token behavior, cache efficiency, and model-switch opportunities. Visit SpendLens AI to instrument your existing Python services, identify practical savings opportunities, and turn unpredictable LLM bills into measurable operating decisions.