Cloud App Monitoring for AI Workloads and FinOps
Master cloud app monitoring for modern AI and LLM workloads. Learn metrics, architecture patterns, tooling tradeoffs, and cost optimization strategies.
The popular advice is to put CPU, memory, uptime, latency, and error-rate dashboards in front of the team, then assume the application is healthy when they stay green. That approach works for many conventional services. It fails for AI workloads because an inference request can be expensive, slow, or semantically wrong while returning a successful HTTP response.
Cloud app monitoring now has to connect reliability, model behavior, telemetry volume, and spend attribution. The observability market itself was valued at USD 4.1 billion in 2024 and is estimated to reach about USD 18.1 billion by 2034, with cloud and SaaS deployment accounting for 68.6% of market share in 2024, according to Market.us research on the observability market. That shift reflects a practical reality for platform and FinOps teams: monitoring is no longer only an incident-response function. It's part of how organizations control cloud infrastructure, application performance, and AI economics.
Table of Contents
- Why Traditional Cloud Monitoring Fails AI Workloads
- The Four Layers of Modern Cloud App Monitoring
- Key Metrics That Drive Cost and Performance Decisions
- Choosing Between Monitoring Approaches and Tools
- Turning Monitoring Signals Into Actionable Cost Savings
- Implementation Checklist for Cloud App Monitoring
- Real Scenarios Where Monitoring Prevented Cost Overruns
Why Traditional Cloud Monitoring Fails AI Workloads
A green dashboard can tell you that a request completed. It can't tell you whether the request consumed an unreasonable amount of context, used a model that was too powerful for the task, triggered expensive retries, or returned an answer that failed a quality check.
Traditional monitoring was designed around relatively stable service signals. Teams watch CPU saturation, memory pressure, request latency, throughput, and HTTP errors. Those metrics remain necessary, but AI introduces costs and failure modes that sit above the infrastructure layer.
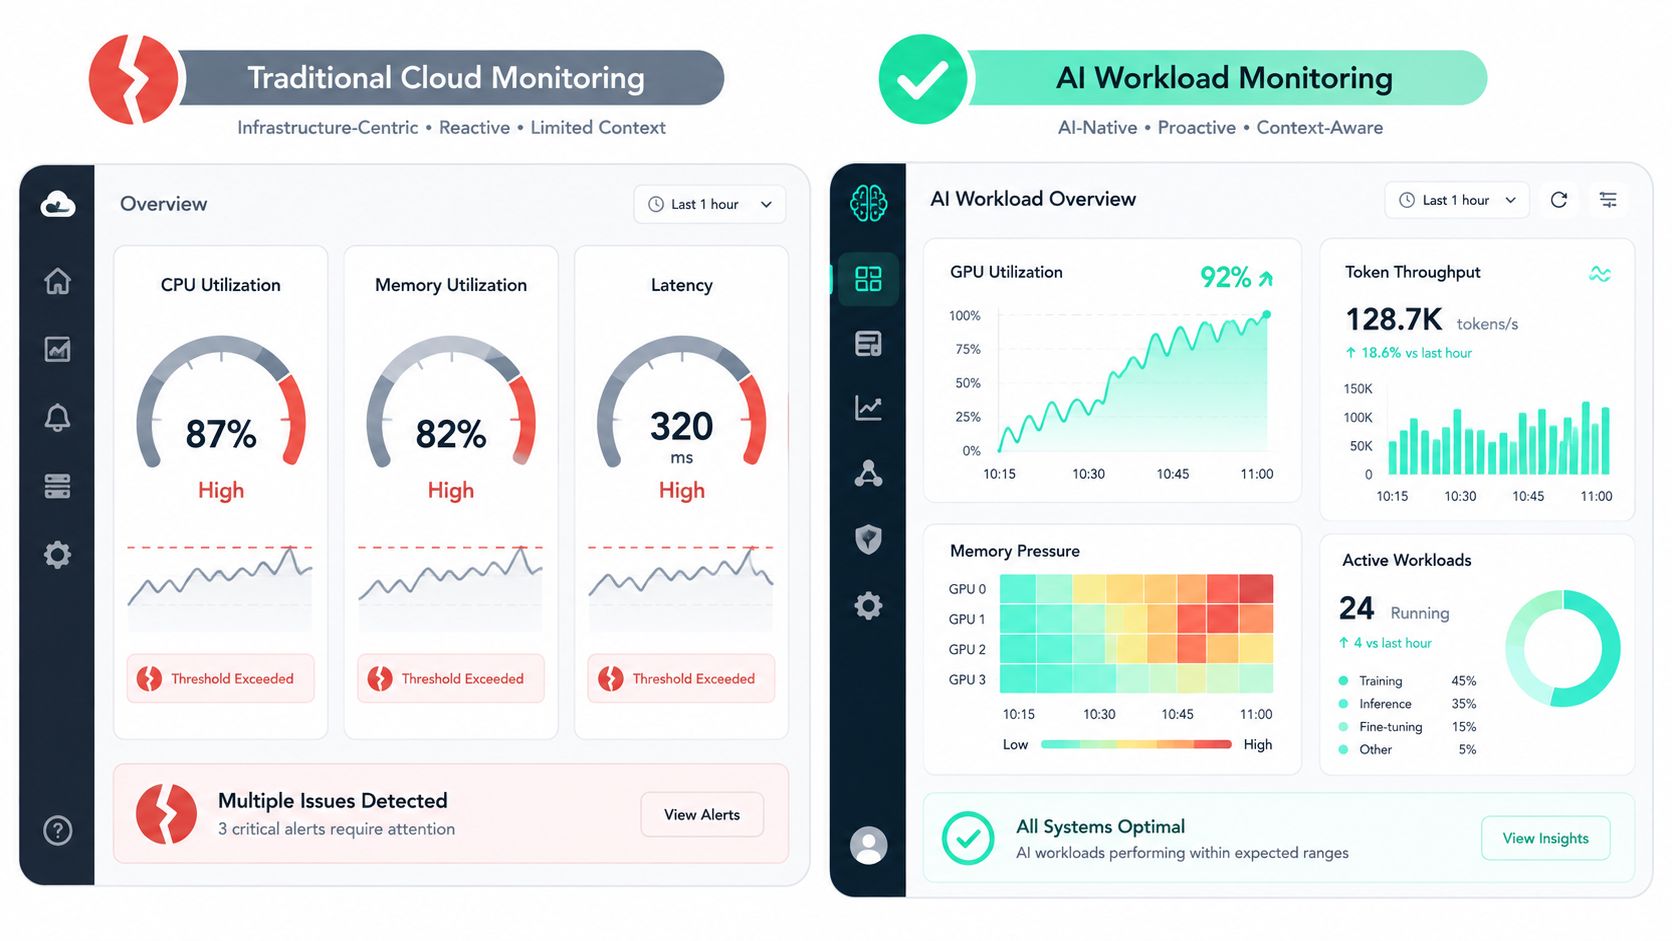
The green dashboard fallacy
An LLM endpoint can return a 200 OK response while producing a poor result or consuming excessive provider credits. A conventional error tracker sees success. Your finance team sees the consequence later, when the invoice arrives without enough context to identify the feature, tenant, prompt template, or deployment responsible.
The first blind spot is token-driven cost growth. User input changes the size of the request, and long system instructions, retrieved documents, conversation history, and duplicated context can inflate consumption without producing better output. Request count alone hides that variation. A hundred short classification calls and a hundred long retrieval-augmented generation calls may look identical on an availability dashboard while carrying very different economics. For a deeper treatment of this limitation, see why token counts alone don't tell the full story.
The second blind spot is prompt-dependent latency. Model response time can change materially with prompt complexity, output length, provider queueing, and model selection. CPU utilization on the calling service may remain normal because the waiting happens outside the application process.
Quality failures don't raise HTTP errors
The third failure mode is semantic. Hallucinations, irrelevant answers, unsafe completions, and failed tool calls can all pass transport-level checks. Traditional logs may show a completed request, but they won't automatically reveal whether the answer satisfied the user or violated a guardrail.
Useful AI monitoring therefore captures more than infrastructure health:
- Cost context: Provider, model, endpoint, tenant, feature, workflow, input tokens, output tokens, and cache usage.
- Prompt waste signals: Repeated instructions, excessive retrieved context, oversized templates, and unnecessarily long outputs.
- Quality indicators: Relevance evaluations, validation results, tool-call success, refusal patterns, and guardrail triggers.
- Trace context: The full chain from user request through retrieval, orchestration, model calls, retries, and post-processing.
Practical rule: Treat a successful model response as an event to evaluate, not proof that the workload performed well.
Google Cloud's pricing history illustrates why this discipline matters. Monitoring API reads were billed at $0.01 per 1,000 read API calls, with the first 1 million read API calls included per billing account, from July 1, 2018 through October 1, 2025. Google also lists Prometheus-format monitoring data at $0.060 per million samples for the first 0 to 50 billion samples ingested in its 2023 pricing update. The move from simple API-call billing toward telemetry-volume and time-series-based models is documented in Google Cloud Observability pricing information. AI teams should assume that observability itself needs cost controls, especially when ephemeral workloads generate high-cardinality traces and logs.
The Four Layers of Modern Cloud App Monitoring
A workable monitoring design separates four layers, then correlates them through a shared trace or request identity. Each layer answers a different operational question. Infrastructure tells you whether resources are constrained. The model layer explains inference behavior. Application telemetry shows how requests move through services. Business attribution identifies who benefits from, and pays for, the workload.
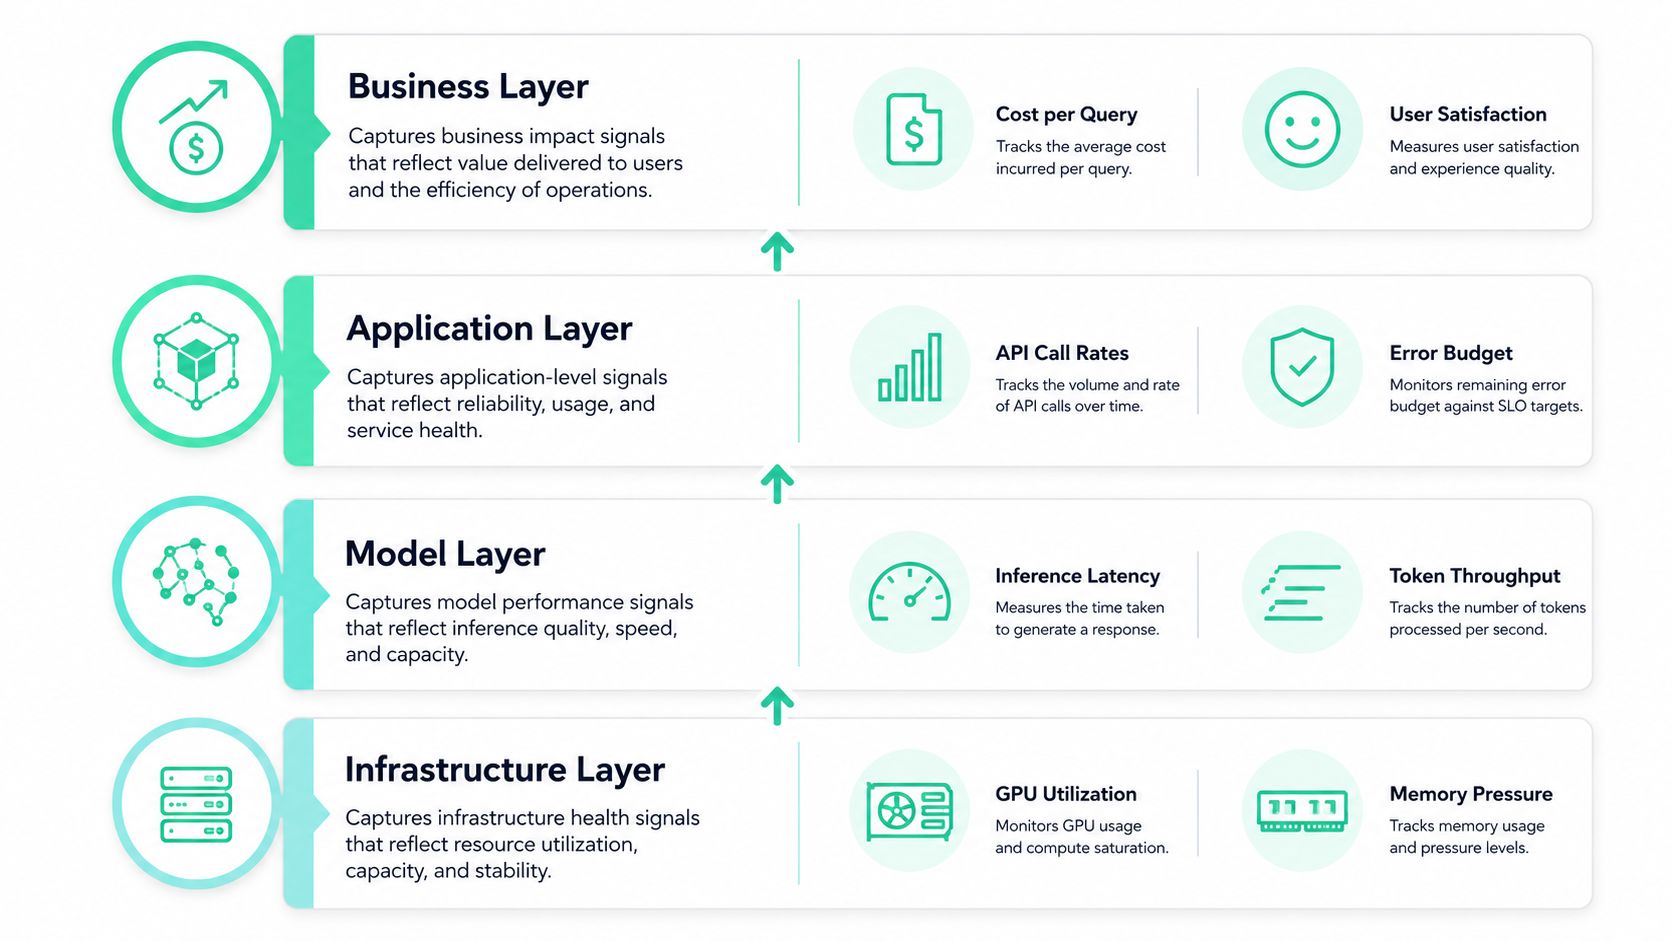
Infrastructure layer
Start with the resources that execute or support the workload:
- GPU utilization and memory pressure reveal saturation, fragmentation, and leaks.
- Node and pod scheduling show whether inference capacity is stranded or frequently rescheduled.
- Network throughput exposes bottlenecks in retrieval, model serving, or cross-region traffic.
- Queue depth and worker concurrency indicate demand more accurately than CPU alone for asynchronous inference.
A GPU memory leak might first appear as steadily increasing memory pressure, followed by pod restarts. The application layer may experience that same issue as rising tail latency and timeout errors. The business layer may only reveal the damage when retries increase spend per completed workflow.
Model layer
The model layer captures signals that generic APM agents rarely understand without custom instrumentation:
- Input and output token counts
- Time to first token and total generation time
- Model and provider selection
- Prompt-cache usage and cache hit behavior
- Fallbacks, retries, tool calls, and guardrail triggers
- Evaluation or relevance signals
A prompt change can increase input tokens while GPU utilization stays flat. A model switch can reduce direct API spend while worsening response time or answer quality. These outcomes require model-aware spans, not merely endpoint timing.
Application layer
Application traces connect the model call to the service that initiated it. Instrument retrieval, authorization, feature flags, queues, databases, external APIs, and post-processing. A trace should make it possible to distinguish a slow model from slow document retrieval, a retry loop from legitimate user activity, and a failed tool call from a provider error.
Distributed tracing also helps teams identify where a single user action creates multiple model calls. That fan-out often explains why an apparently efficient endpoint carries disproportionate cost.
Business layer
The business layer maps technical events to features, tenants, teams, workflows, and customer journeys. A support assistant may be profitable for enterprise accounts but uneconomical for free users. A summarization feature may have acceptable average spend while one export workflow consumes most of the budget.
A useful implementation assigns stable attributes such as project, feature, tenant, workflow, and environment to every relevant span. Avoid storing raw prompts or responses by default. Hash prompt templates, sample only approved content, and keep sensitive payloads outside general telemetry.
Teams adopting this layered approach can also review AI observability platform design for a practical view of how these signals fit together.
Key Metrics That Drive Cost and Performance Decisions
A monitoring dashboard should answer, what decision will this metric change? If the answer is unclear, the metric probably belongs in exploratory telemetry rather than the operational view.
The most useful measures connect an AI request to both user experience and unit economics. Track them by model, endpoint, feature, tenant, and release wherever the dimensions remain safe and operationally manageable.
| Metric | What It Measures | Decision Threshold | Business Impact |
|---|---|---|---|
| Cost per completed request | Spend required to finish a request, including retries and fallback calls | Rising cost requires review of prompt size, model tier, caching, and retry behavior | Protects feature margins and improves forecasting |
| Input-to-output token ratio | The relationship between supplied context and generated content | A worsening ratio prompts context trimming, retrieval filtering, or template review | Reduces prompt waste without automatically reducing answer quality |
| Prompt-cache hit ratio | How often repeated or reusable context is served from cache | A sustained decline supports investigation of cache keys, template stability, and embedding flow | Lowers repeated inference consumption |
| Time to first token | Delay before the user sees generated output | A degradation triggers review of model choice, queueing, retrieval, and streaming configuration | Improves perceived responsiveness |
| Total model latency | End-to-end inference duration | A model with excessive latency may be unsuitable for interactive paths | Supports routing by user experience requirements |
| Spend by tenant or feature | Allocation of model and infrastructure cost | A feature exceeding its budget needs product, pricing, or engineering action | Enables accountability and informed roadmap decisions |
| Retry and fallback rate | Additional model calls caused by failures or policy decisions | A spike requires trace-level inspection of provider errors and application logic | Prevents unsuccessful work from multiplying spend |
| Quality score or guardrail trigger rate | Whether output meets task-specific requirements | A quality decline blocks cost-only model downgrades | Avoids savings that damage customer outcomes |
Raw request count remains useful for capacity planning, but it isn't a cost metric. Pair it with cost per request, token volume, and completed business outcomes. A feature that handles fewer requests can still consume more budget if it uses long prompts or expensive models.
Set thresholds from observed baselines rather than copied industry values. For example, if a model-switch experiment maintains answer quality while reducing cost per completed request, route only the eligible workload. Do not downgrade sensitive or high-value flows because their average cost looks high.
Endpoint-level dimensions make that analysis practical. The endpoint monitoring guide is relevant when teams need to connect request paths with latency, errors, and spend rather than treating all model traffic as one pool.
Choosing Between Monitoring Approaches and Tools
There isn't one correct observability stack for every AI organization. The right choice depends on how many clouds and model providers you operate, how much custom instrumentation you can maintain, and whether finance needs allocation at request level or only at account level.
| Approach | Instrumentation Effort | LLM Observability | Cost Attribution | Multi-Cloud | Pricing Risk |
|---|---|---|---|---|---|
| Agent-based APM, such as Datadog or New Relic | Low to moderate initial effort | Strong for standard application traces, variable for token and prompt detail | Usually good for infrastructure and service dimensions, custom work needed for model economics | Depends on integrations and deployment coverage | Agent, host, ingestion, and custom-data charges can grow with telemetry |
| OpenTelemetry-native pipeline | Higher engineering ownership | Deep flexibility for custom LLM spans, prompt hashes, and workflow attributes | Strong when teams define consistent cost fields and join billing data | Strong vendor neutrality across clouds and providers | Collector, storage, export, and engineering maintenance costs require governance |
| Cloud-provider-native tooling, such as CloudWatch or Azure Monitor | Fastest path inside one provider | Useful infrastructure visibility, limited semantic context without custom work | Good access to provider billing and resource metadata | Weak correlation across providers unless supplemented | Provider-specific pricing and retention models increase lock-in risk |
| Hybrid architecture | Moderate, because responsibilities are split | OpenTelemetry can carry model and application context while native tools cover infrastructure | Can combine billing exports with trace dimensions | Better coverage when ownership boundaries are explicit | Multiple products create overlapping ingestion and retention costs |
Agent-based APM is attractive when a team needs dashboards and alerting quickly. It becomes less comfortable when an organization needs prompt-template attribution, model comparisons, or provider-neutral semantics. Custom attributes may also increase telemetry volume and cost if teams attach unbounded values such as raw prompts.
OpenTelemetry offers the cleanest escape route from vendor lock-in. Define a stable internal schema for model name, provider, token counts, cache usage, workflow, and cost estimate. Then export traces to the backend that fits each team. The trade-off is real engineering work. Collectors, exporters, sampling policies, cardinality controls, and schema changes need ownership.
Cloud-native tools make sense for GPU nodes, managed Kubernetes, serverless infrastructure, and billing integration within one provider. They don't automatically provide a unified view when a service calls multiple model providers across regions.
A practical hybrid pattern is to use OpenTelemetry for application and model traces, cloud-native dashboards for infrastructure and billing, and a FinOps reporting layer for allocation. Keep provider client calls direct where possible, and avoid placing a proxy in the inference path unless its routing and latency behavior are understood.
Turning Monitoring Signals Into Actionable Cost Savings
Dashboards don't save money by themselves. Engineers save money when a signal leads to a controlled change, and when the same dashboard verifies that reliability and quality stayed within bounds.
Start with endpoint-level token trends. If input consumption rises after a prompt-template deployment, compare the new template with the prior version. Look for duplicated instructions, excessive conversation history, broad retrieval results, and documents that don't influence the answer. Prompt compression, better retrieval filtering, or stable prompt caching can reduce waste without changing the user-facing feature.
Next, correlate latency and cost by model tier. A premium model may be appropriate for complex reasoning, but a lightweight model may handle classification, extraction, routing, or simple summarization. Use evaluation results and user outcomes to determine eligibility. Cost alone isn't enough.
Build a cost-aware control loop
A useful operating loop looks like this:
- Detect: Find abnormal token use, retry growth, GPU idle time, or per-feature spend.
- Explain: Follow the trace through prompts, retrieval, provider calls, fallbacks, and post-processing.
- Change: Apply caching, prompt compression, model routing, retry limits, or resource scheduling.
- Validate: Compare spend, latency, quality, and completion rates against the baseline.
- Enforce: Add budget alerts, quotas, deployment checks, and ownership rules so the waste doesn't return.
Cost-aware SLOs should include a spend boundary alongside availability and latency objectives. If one feature exceeds its allocated budget, alert the owning team before month-end reporting. If a model version causes error spikes, inspect retries and fallback chains because failed calls can create additional cost without producing a completed outcome.
Infrastructure automation also needs the right signal. For queued inference, scale on queue depth, request age, and worker utilization rather than CPU alone. Conversely, reduce capacity when the workload is idle and the service supports safe scaling. The goal isn't to minimize resources at any cost. It's to match capacity to demand while protecting user experience.
The useful question isn't “Is the service up?” It's “What did this completed workflow cost, and did it deliver the expected result?”
Use the following video as a supplementary visual reference for the relationship between monitoring signals, scaling decisions, and optimization:
Implementation Checklist for Cloud App Monitoring
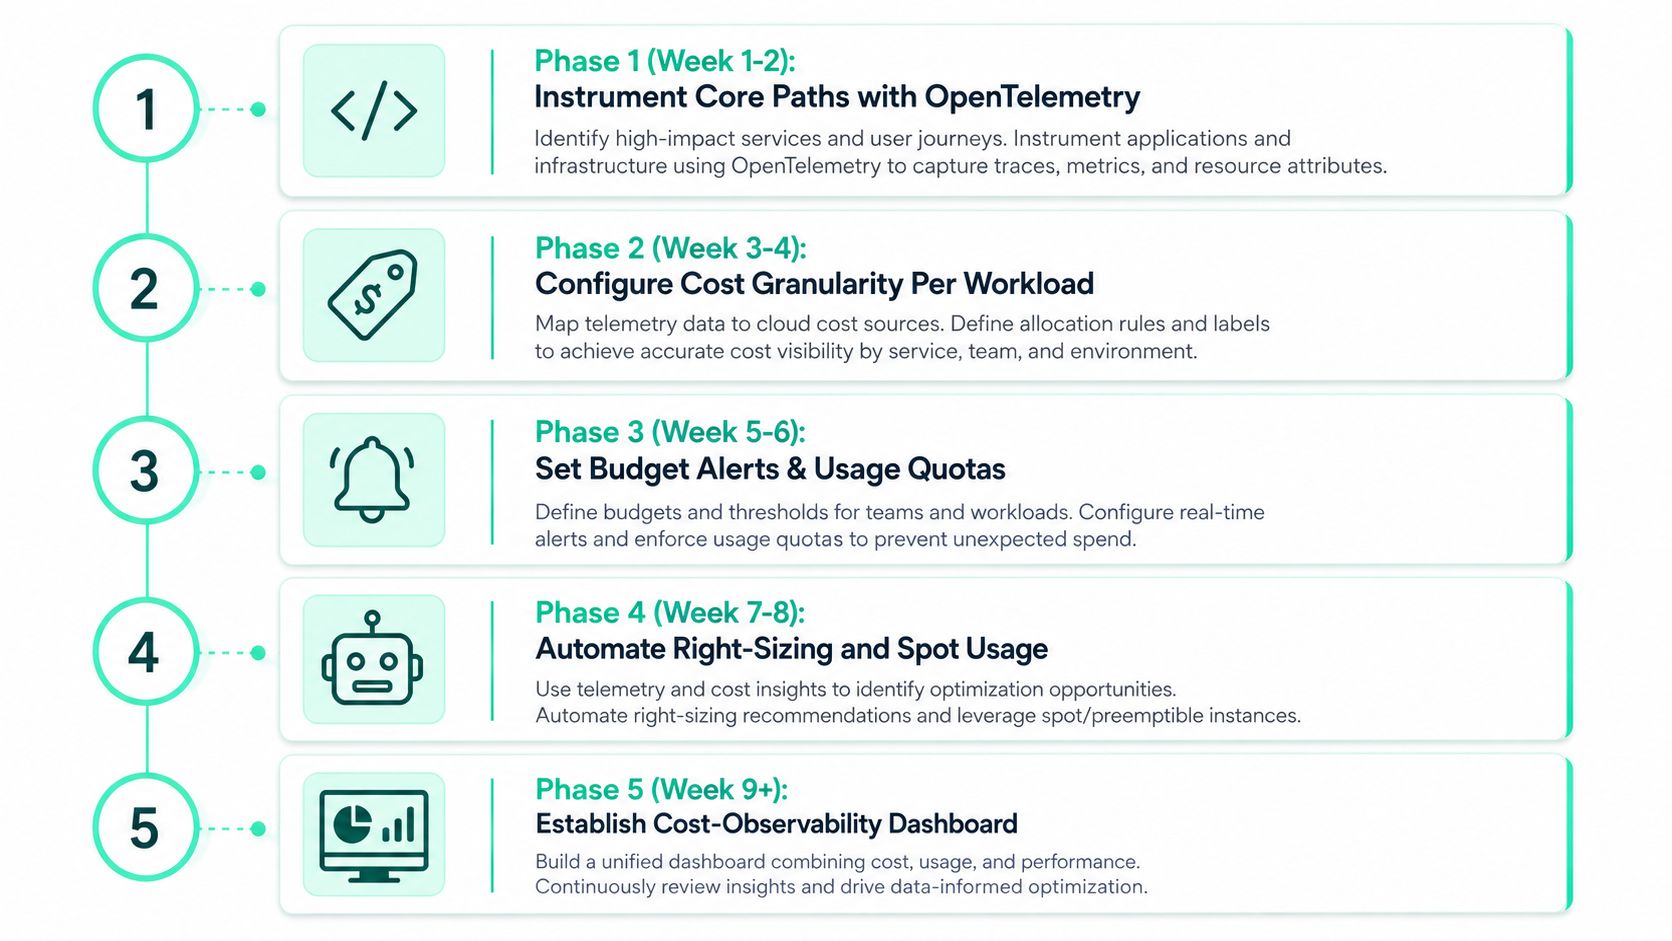
A phased rollout prevents teams from spending weeks instrumenting every service before they know which signals matter. Start with the paths that call models and affect customers, then expand coverage after the baseline is trustworthy.
Phase one and two
During weeks 1 and 2, add OpenTelemetry auto-instrumentation to core application paths. Establish baseline latency, error rate, throughput, queue behavior, and dependency timing. Connect cloud billing exports to the monitoring or FinOps backend so technical traces can eventually reconcile with actual spend. The outcome is visibility into request flow and a reference point for later optimization.
During weeks 3 and 4, add custom spans around every LLM call. Capture provider, model, input and output token counts, latency components, prompt-template hash, retry status, and workflow context. Propagate trace IDs across service boundaries, and define initial SLOs from observed behavior rather than assumptions.
Phase three and four
During weeks 5 and 6, build dashboards that group spend by feature, team, tenant, project, model, and environment. Add anomaly detection for sudden token growth and retry increases. Implement caching for repeated queries where correctness and data freshness allow it.
During weeks 7 and 8, turn validated recommendations into controlled automation. Review right-sizing opportunities for inference nodes, idle GPU capacity, concurrency settings, and scheduled workloads. Add policy checks that prevent unowned model calls or missing cost attributes from reaching production.
Phase five and ongoing operations
From week 9 onward, maintain a cost-observability dashboard that combines spend, quality, latency, and resource utilization. Compare models on equivalent workloads, refine alert thresholds, and review optimization changes with engineering, product, and finance stakeholders.
Keep privacy controls explicit. Store metadata by default, hash sensitive identifiers, and sample prompt content only when the team has approved the security and retention model.
The measurable outcomes should be operational, not decorative:
- Faster investigation: Engineers can follow an expensive request from endpoint to provider call.
- Clearer ownership: Teams can identify which feature or workflow generated spend.
- Safer optimization: Model changes are evaluated against latency and quality signals.
- Better forecasting: Finance can use workload-level trends instead of receiving an opaque provider total.
- Less wasted telemetry: Sampling and cardinality controls keep monitoring spend aligned with diagnostic value.
Don't optimize before you can measure the baseline. Otherwise, a team may celebrate a lower bill that came from reduced usage, degraded quality, or an unrelated product change.
Real Scenarios Where Monitoring Prevented Cost Overruns
Production examples make the operating model concrete, but they also require careful sourcing. The three scenarios below are illustrative operating scenarios, not attributed customer case studies. Their value is in showing which signal should trigger investigation and what action follows.
A SaaS team notices that one assistant endpoint has sharply higher token consumption than comparable requests. The trace shows a retry loop re-sending the same model call after a downstream parsing failure. Engineers inspect the retry policy, cap repeated attempts, and add an alert on retry cost rather than only provider errors. The saving comes from eliminating duplicate work while preserving successful requests, and the team can validate it through completed-request cost and parser success rate.
An e-commerce team sees low GPU utilization on an inference cluster during normal traffic, while a feature flag continues routing requests to that oversized capacity. Cloud app monitoring correlates the flag state, queue depth, GPU utilization, and endpoint traffic. The team corrects the routing rule and adjusts capacity to match demand. The benefit is money saved through avoided idle infrastructure, with user latency checked before and after the change.
A fintech team compares prompt traces for a high-cost reasoning workflow and finds that many requests use a premium model for a task with stable, simple outputs. Engineers create an evaluation set, test a lighter model, and route only the validated request class to it. The benefit is measured through lower inference spend per completed workflow, while quality, guardrail triggers, and escalation rates remain part of the release decision.
For automated detection, teams can combine trace attributes with budget rules and review AWS cost anomaly detection practices. The important pattern is consistent: identify the signal, preserve enough context to explain it, make a bounded change, and verify both savings and service quality.
FinOps governance must support that loop. The FinOps Foundation recommends identifying untagged taggable resources, assessing the impact, educating engineers, correcting current resources, publishing compliance dashboards, and enforcing tags through provider controls such as AWS service control policies in its cloud cost allocation guidance. Microsoft similarly recommends a tagging strategy, handling processes for misses, and Azure Policy enforcement in its allocation guidance. Tagging compliance can be tracked with the FinOps Foundation's formula, (Total Cost of Tagging Policy Compliant Cloud Resources / Total Cost of Cloud Resources) x 100, as described in its tagging policy compliance measurement guidance.
A broader modernization example comes from a Forrester Total Economic Impact study of Elastic Observability, which reports just under $250,000 in annual savings from retiring legacy monitoring tools, alongside a composite organization realizing $15.69 million in benefits, $4.58 million in costs, and 243% ROI over three years. The lesson isn't that every migration will produce those results. It's that consolidating overlapping tools and connecting observability to operating decisions can create measurable time and money value when the business case is validated against the organization's own baseline.
SpendLens AI adds lightweight instrumentation for OpenAI and Anthropic workloads, attributing calls to projects, features, workflows, tasks, experiments, or endpoints while surfacing token usage, cache efficiency, prompt waste signals, and model-switch opportunities. Visit SpendLens AI to connect LLM spend with the cloud app monitoring signals your engineering and FinOps teams already use.