
AI Model Cost Comparison: How to Choose the Right LLM
Master AI model cost comparison with real pricing data, benchmarking methods, and decision criteria to cut LLM spend without sacrificing quality.
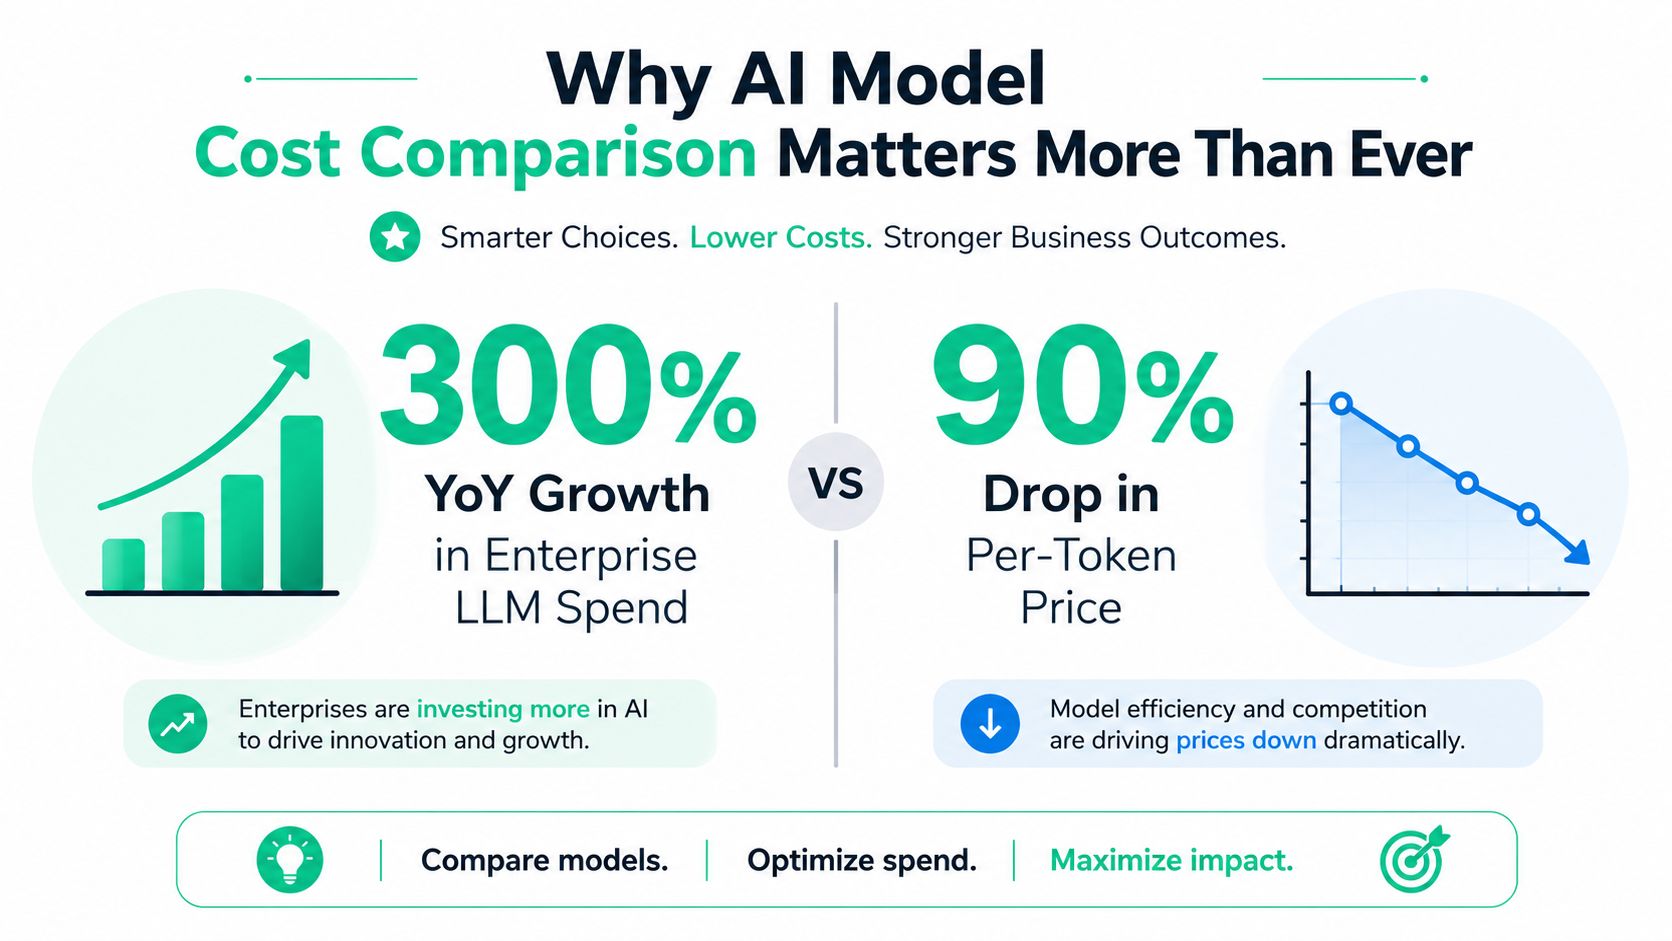
Frontier LLM input costs fell from about $60 per million tokens in early 2023 to under $1 by mid-2026, a decline of more than 98% in roughly three and a half years, according to Finout's pricing timeline. Yet cheaper tokens haven't automatically produced cheaper AI products. Teams still overspend because the invoice reflects far more than the model's advertised rate. Context length, output volume, cache behavior, retries, retrieval, validation, and infrastructure can determine the final cost of a successful task.
That changes the central question. A useful ai model cost comparison doesn't ask which API has the lowest input price. It asks which model and architecture deliver the lowest end-to-end cost per successful outcome for a defined workload.
Table of Contents
- Why AI Model Cost Comparison Matters More Than Ever
- Current Pricing Across Major Model Families
- Hidden Cost Multipliers That Change the Ranking
- Building an Apples-to-Apples Benchmarking Method
- Decision Criteria for Model Switching
- Real-World Scenarios and Savings Examples
- Implementing Cost Tracking and Optimization
Why AI Model Cost Comparison Matters More Than Ever
The apparent contradiction is straightforward: model access is getting cheaper while production AI bills can still rise. The verified pricing timeline shows frontier input costs moving from about $60 per million tokens to under $1 per million tokens, but a lower unit price doesn't control request volume, prompt size, output length, or the number of attempts required to finish a task.
A finance team reviewing only input tokens can miss the primary spend driver. A support summarizer may use a low-cost model but attach a large conversation history to every request. A retrieval-augmented generation system may pay for retrieved documents, repeated system instructions, and output validation before a user sees an answer. An agent may call several models during one workflow, then retry a failed step.
Practical rule: compare the cost of a completed, accepted task, not the cost of an isolated API call.
The useful unit is cost per successful task
Model choice creates wide price differences. The 2026 OpenAI and Anthropic pricing comparison lists Claude Opus 5 at $5 input and $25 output per million tokens, Claude Sonnet 5 at an introductory $2/$10 rate through August 31, 2026, and Claude Haiku 4.5 at $1/$5. The same tables list GPT-5.6 Sol at $5/$30, GPT-5.6 Terra at $2/$12, and GPT-5.6 Luna at $0.20/$1.20.
Those tiers can make the same workload differ by 5x to 25x or more, depending on model selection, as documented in that comparison. But the cheapest model isn't automatically the right choice. If it produces malformed JSON, misses key fields, or requires repeated attempts, its effective cost can exceed that of a more capable model.
The stronger benchmark is:
Total production spend ÷ accepted business outcomes
For extraction, the outcome might be a document that passes field-level validation. For classification, it might be a correctly routed ticket. For generation, it could be content that clears an evaluator or human review. This measure captures the value of time saved, because fewer manual corrections and retries reduce both API consumption and operational effort.
Teams should therefore record model, prompt version, input tokens, output tokens, cache status, retrieval volume, retries, latency, validation failures, and task outcome. Without those fields, an AI model cost comparison remains a price-sheet exercise rather than a FinOps control.
Current Pricing Across Major Model Families
Public pricing tables show why model selection is a budget decision, not merely an engineering preference. Current examples place flagship and economy models in sharply different tiers, while output tokens generally carry a higher rate than input tokens.
The table below uses the verified 2026 examples available for OpenAI and Anthropic. It avoids filling unsupported legacy model prices with invented values.
| Provider | Model | Tier | Input Price ($/1M) | Output Price ($/1M) | Context Window |
|---|---|---|---|---|---|
| Anthropic | Claude Opus 5 | Frontier | $5 | $25 | Not specified in cited table |
| Anthropic | Claude Sonnet 5 | Balanced | $2 | $10 | Not specified in cited table |
| Anthropic | Claude Haiku 4.5 | Economy | $1 | $5 | Not specified in cited table |
| OpenAI | GPT-5.6 Sol | Frontier | $5 | $30 | Not specified in cited table |
| OpenAI | GPT-5.6 Terra | Balanced | $2 | $12 | Not specified in cited table |
| OpenAI | GPT-5.6 Luna | Economy | $0.20 | $1.20 | Not specified in cited table |
| Anthropic | Claude Sonnet 4.6 | Standard | $3 | $15 | 200K standard, up to 1M extended |
| Anthropic | Claude Opus 4.6 | Frontier | $5 | $25 | 200K standard, up to 1M extended |
Anthropic's Claude API cost breakdown lists Sonnet 4.6 at $3 input and $15 output per million tokens, compared with Opus 4.6 at $5 input and $25 output. Both support 200K standard context and up to 1M extended context. For high-volume work that doesn't require Opus-level capability, Sonnet is therefore the materially cheaper option.
Input price isn't the whole rate card
Output-heavy workloads deserve special attention. A model can look affordable when a team reviews input pricing, then become expensive when it generates long explanations, code, reasoning traces, or structured responses. This is why a summarization or agent workload should report input and output tokens separately.
Caching adds another pricing dimension. OpenPricing's model comparison resource highlights separate cached-input rates and discounts that can reach 90% for cache hits on some models. Anthropic's pricing mechanics are more explicit: cache reads cost 10% of standard input price, while cache writes cost 1.25x the base input rate for a five-minute cache or 2x for a one-hour cache, according to this Anthropic pricing guide.
Rates also change, introductory prices expire, and providers add or retire model variants. Verify the live provider rate card before running a benchmark, then freeze the prices used in the analysis so the result remains auditable.
For a broader provider-by-provider view, use SpendLens AI's cheapest AI API comparison as a starting point, then validate every candidate against the provider's current documentation and your own measured workload.
Hidden Cost Multipliers That Change the Ranking
A static token table answers only one narrow question: what does the provider charge for a token under a specific billing condition? It doesn't answer how many tokens your architecture sends, how often the provider charges a premium rate, or how much supporting work surrounds each request.
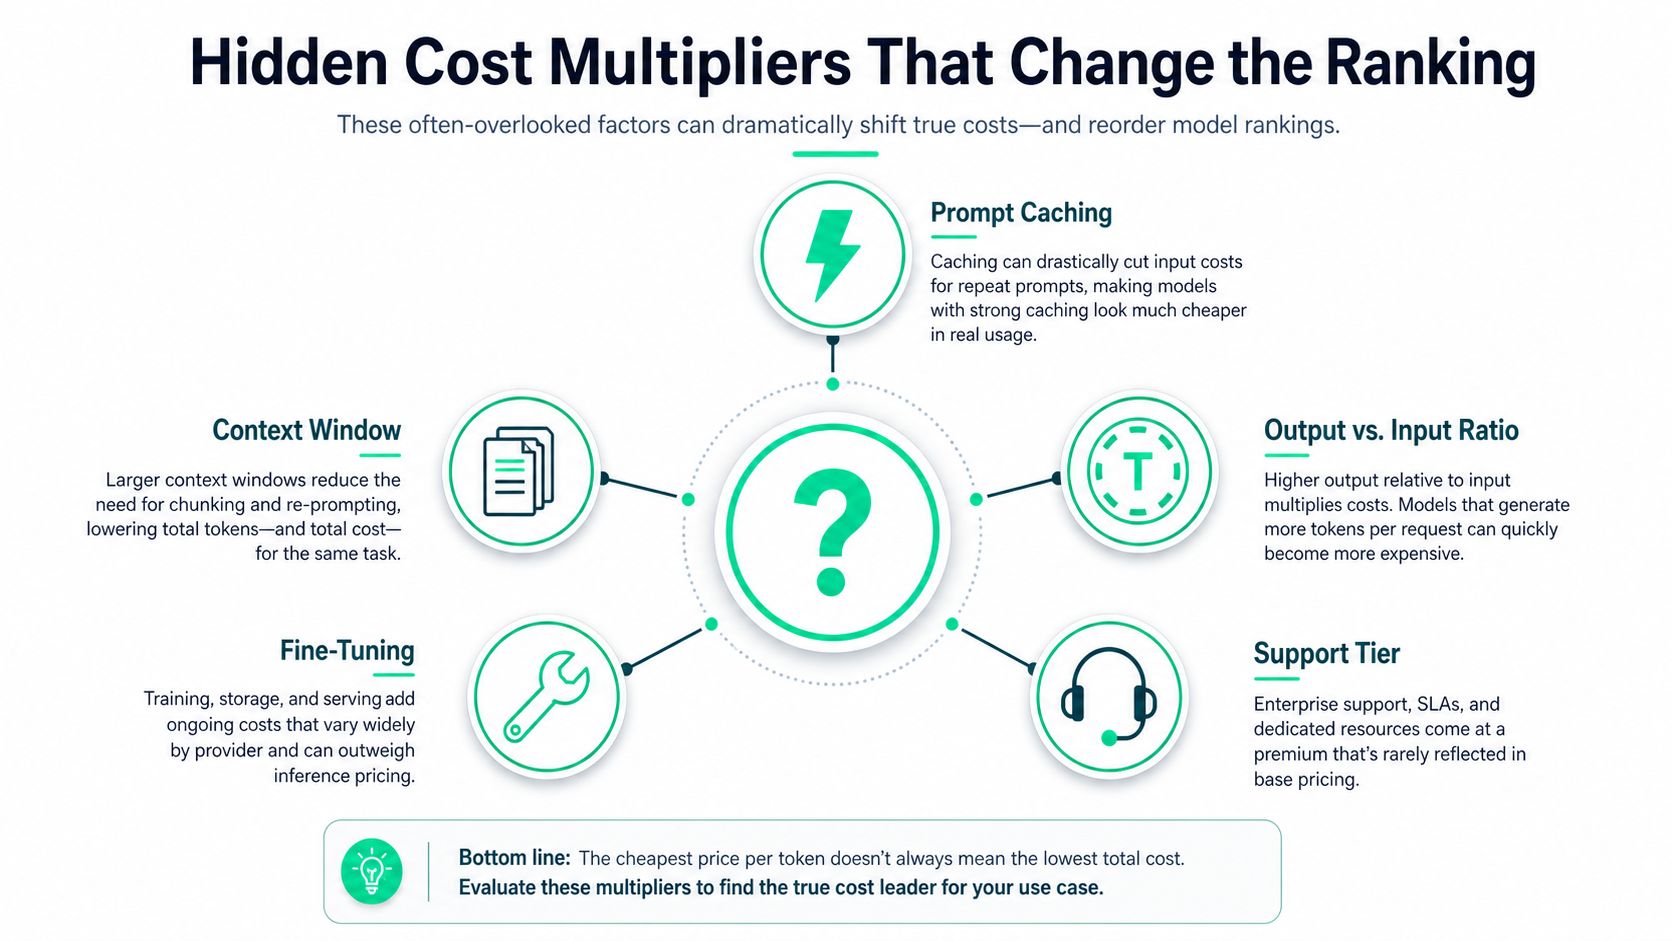
Five factors distort simple comparisons
Caching changes repeat-work economics. Anthropic cache reads cost 10% of standard input pricing, and the cited example shows cached Sonnet 4.6 input at $0.30 per million tokens versus $3.00 for standard input. A stable system prompt, policy block, or agent prefix can therefore become much cheaper after the cache is warm. A cache write still has a charge, so teams should measure hit rates rather than assume every repeated prompt qualifies.
Long context multiplies spend. A worked context-window cost example shows GPT-4o input at $2.50 per million tokens costing about $0.0000025 for 1K tokens, $0.000025 for 10K, $0.00025 for 100K, and $0.00032 for a full 128K context. The lesson is simple: retrieved passages and conversation history add cost linearly before the model produces an answer.
Extended context can change the rate itself. A 2026 explanation of Anthropic billing changes reports that Opus and Sonnet input rates rise from $5 to $10 per million tokens after 200K, while output rises from $25 to $37.50. A long-context request can therefore incur both more tokens and a higher per-token tier.
Retries erase apparent savings. A low-price model that fails schema validation, misses required fields, or triggers a fallback may consume more total tokens than a higher-priced model that succeeds on the first attempt. Measure retries and validation failures as part of the workload, not as an infrastructure footnote.
Supporting operations dominate surprisingly often. SWFTE's 2026 API pricing analysis says enterprises may spend another $5 to $10 in supporting operations for every $1 spent on model APIs. Its breakdown assigns 45% of token-cost-related spend to inference, 25% to retrieval overhead, 15% to retries and validation, and 15% to monitoring and infrastructure.
Self-hosted open-weight models add GPU capacity, load balancing, deployment, patching, and maintenance labor. A model that appears 10x cheaper per token can become the expensive choice if its operational burden or failure rate is materially higher. Token counts alone don't tell the full cost story, because the workload includes every step required to produce an accepted result.
Building an Apples-to-Apples Benchmarking Method
A defensible benchmark begins with the workload, not the vendor list. Separate requests into extraction, generation, and classification, because each category rewards different model behavior and creates different cost patterns.
Define a representative test set
For extraction, sample documents that contain ordinary cases, missing fields, inconsistent layouts, and edge conditions. For generation, include prompts that reflect the actual content mix and review standard. For classification, preserve the class distribution and include ambiguous examples instead of testing only easy inputs.
Then lock the variables that would otherwise make the comparison unreliable:
- Use identical inputs. Send the same documents, retrieved context, system instructions, and output schema to every candidate.
- Freeze generation settings. Keep temperature, maximum output tokens, tool definitions, and stop conditions consistent where the providers support equivalent controls.
- Record operational measures. Capture latency under representative load, input and output tokens, cache reads and writes, retries, validation failures, and fallbacks.
- Score the result. Use a human rubric, deterministic field checks, or an automated judge that you validate against reviewed examples.
The benchmark should report both cost per request and cost per accepted task. The second metric is the one finance and product leaders can use to make a decision.
A worked invoice pipeline structure
For a 10,000-document invoice extraction pipeline comparing GPT-4o-mini with Claude 3.5 Haiku, build a spreadsheet with one row per document. Include document identifier, model, input tokens, output tokens, retrieved context tokens, cache status, attempt count, validation result, latency, and quality score. Add columns for provider rates and calculate the token charge, retrieval charge, retry charge, and total cost.
The verified brief doesn't provide current prices for GPT-4o-mini or Claude 3.5 Haiku, so the benchmark must pull those rates from the live provider pages rather than assume them. The value calculation is still concrete: if one model reduces manual corrections, the team saves review time as well as API spend. Report that time separately instead of converting it into an unsupported dollar estimate.
The benchmark winner is the model that meets the quality bar at the lowest accepted-task cost, not the model with the lowest advertised input rate.
A reusable workbook should contain tabs for assumptions, test cases, raw request logs, quality judgments, rate cards, and the final decision. SpendLens AI's cost estimation guide can help structure the cost model, but the input data must come from your production-like test run.
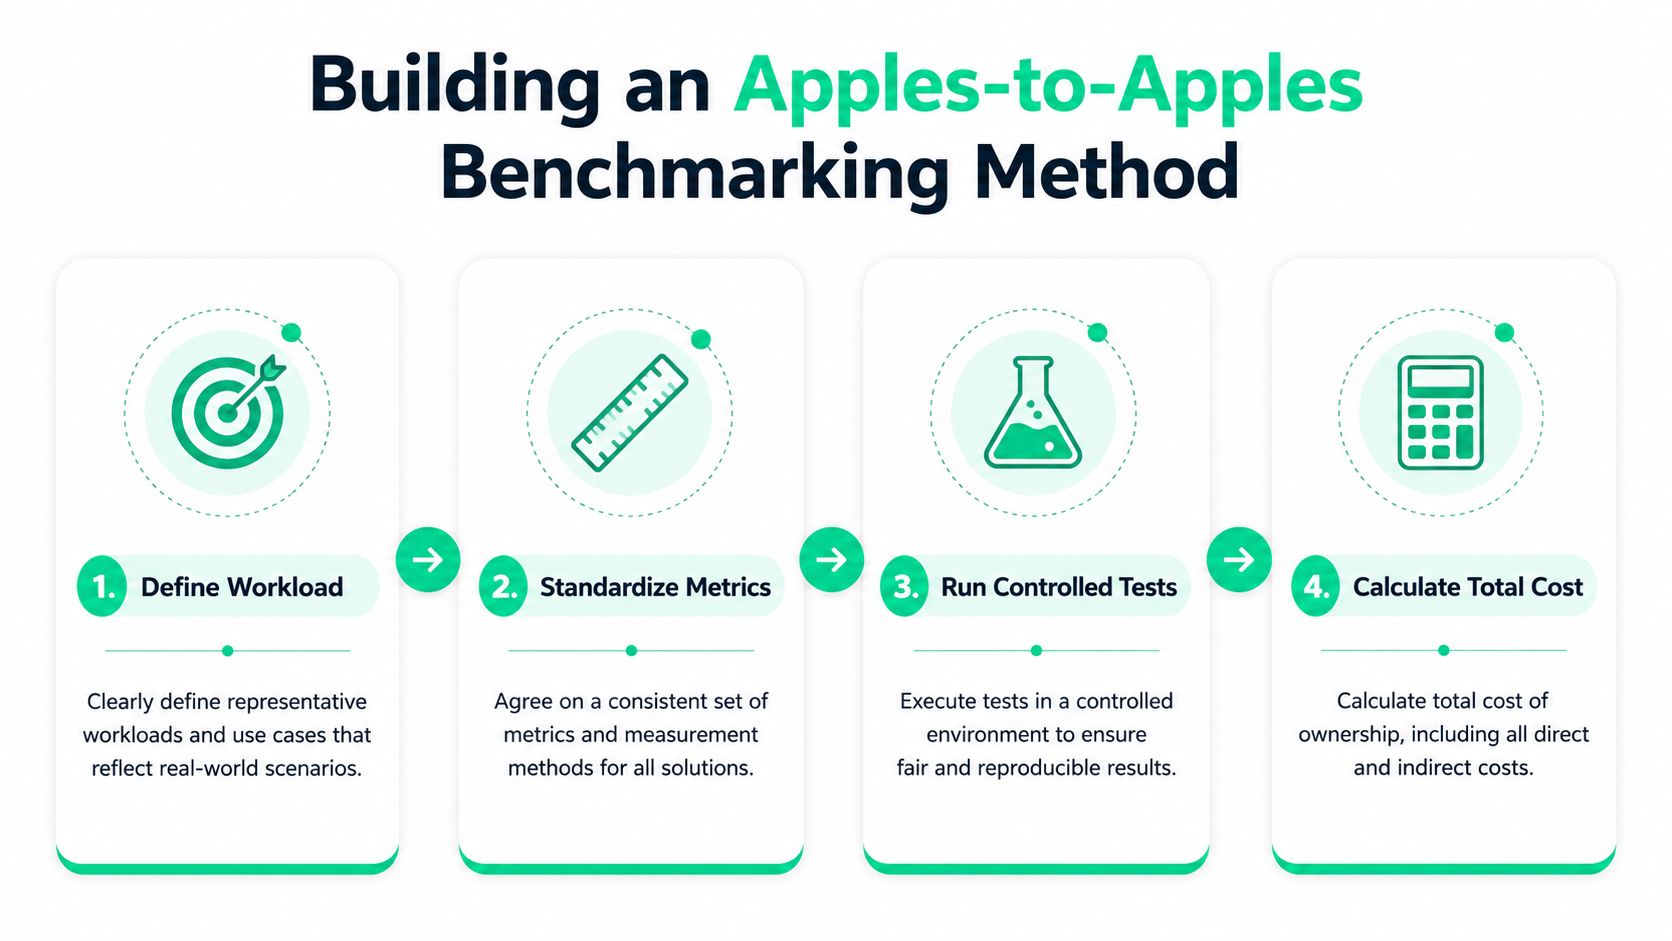
A controlled benchmark also benefits from an explicit audit trail. Store the prompt version, model version, price date, evaluator version, and routing rule so another engineer can reproduce the result.
Decision Criteria for Model Switching
Switching models is a control decision, not a reaction to a single invoice. The team needs a quality floor, a spend ceiling, a latency requirement, and a view of provider concentration. These criteria should be defined before a candidate model enters production.
| Trigger Condition | Threshold | Recommended Action | Estimated Savings |
|---|---|---|---|
| Quality degradation | Below the team's accepted benchmark floor | Test the next capability tier and inspect failure categories | Qualitative until benchmarked |
| Cost per task | Above the approved workload budget | Compare smaller models, caching, prompt reduction, and routing | Qualitative until measured |
| Latency violation | Outside the product's agreed response target | Test a faster tier or asynchronous workflow | Qualitative until measured |
| Provider concentration | Excessive dependence on one API | Maintain a validated fallback and run periodic parity tests | Avoided disruption cost, not predetermined |
The threshold must reflect the task. A legal review workflow may accept slower responses if accuracy remains high. A customer-facing classification endpoint may prioritize predictable latency and low output volume. A model that wins one workload can lose another because the token mix and acceptance criteria differ.
A practical routing policy
Route routine requests to an economy model when the task is well understood and the evaluation set shows stable quality. Escalate ambiguous, long-context, or high-risk requests to a stronger model. Keep the routing decision visible in logs so finance can attribute savings and quality changes to the rule.
The available evidence supports meaningful price separation, not a universal savings promise. The 2026 pricing tables list GPT-5.6 Luna at $0.20 input and $1.20 output per million tokens, while GPT-5.6 Sol is $5/$30, making capability-based routing financially consequential for workloads that can use the lower tier. The same logic applies within Anthropic's range, where Haiku, Sonnet, and Opus occupy different price levels.
Switching also has costs. Engineers must revise prompts, repeat regression tests, update provider-specific handling, and monitor quality after deployment. Count that work in the business case, then compare it with recurring savings from lower token use, fewer retries, better cache utilization, or reduced retrieval volume.
A sound decision record should state the incumbent, candidate, test set, quality result, cost-per-accepted-task result, latency result, migration effort, and rollback condition. That record turns model switching from opinion into an auditable investment.
Real-World Scenarios and Savings Examples
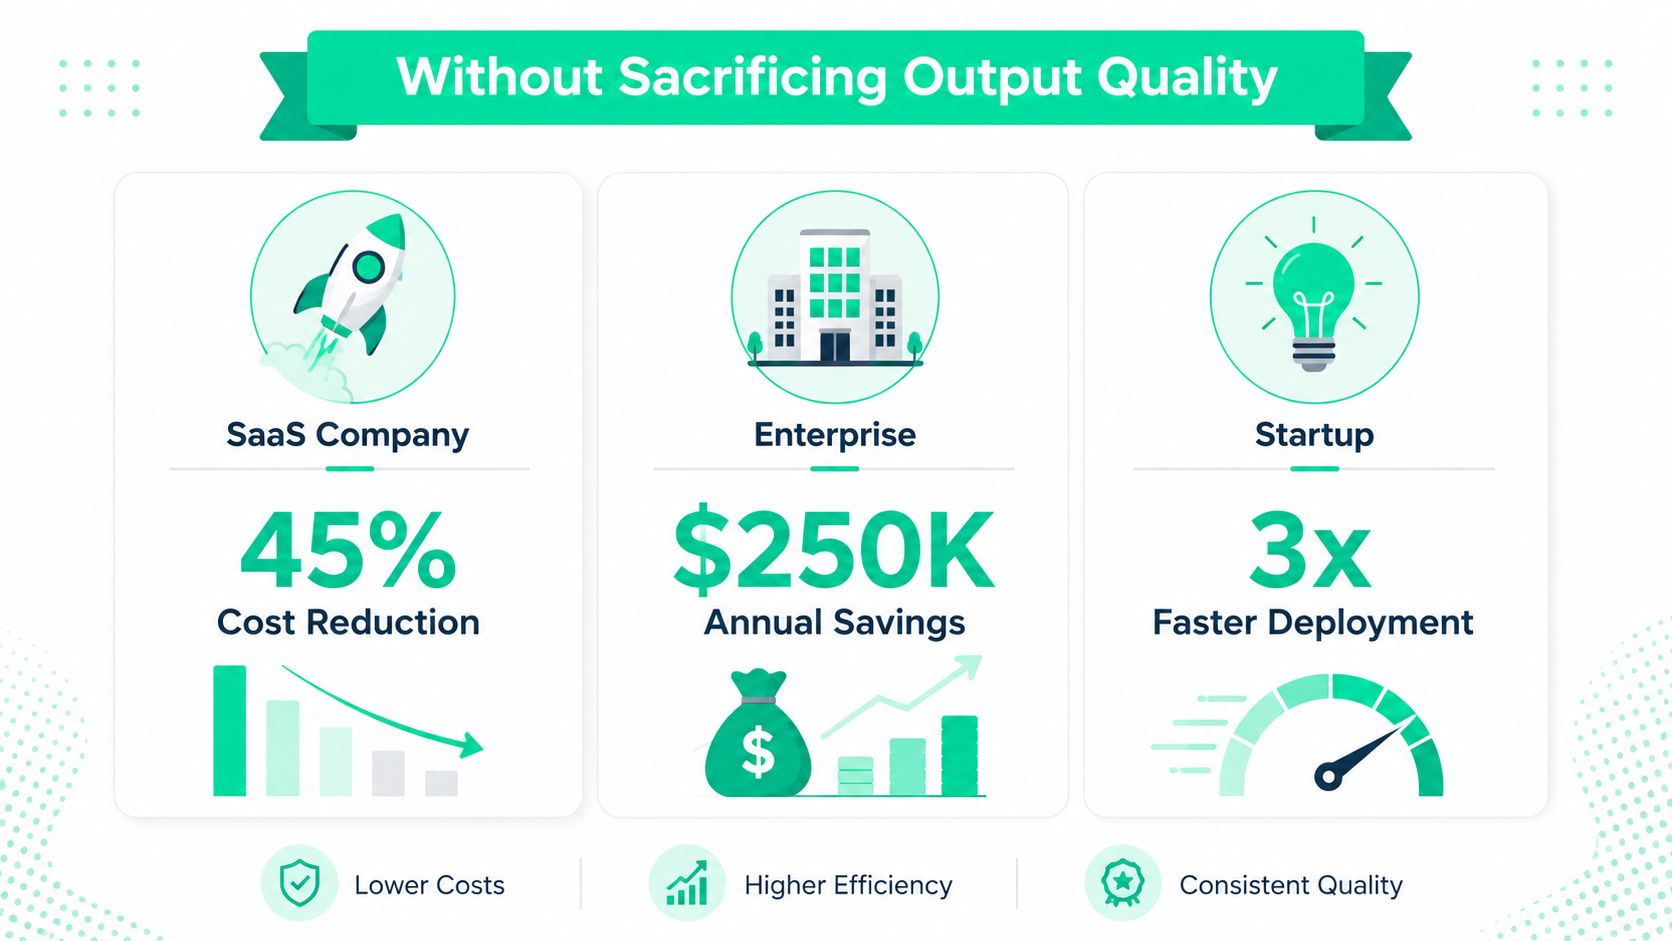
The requested examples include precise savings figures and named company scenarios, but those figures aren't present in the verified data. They shouldn't be presented as factual case studies. The defensible approach is to use scenario models that show exactly where value would come from and label every result as a calculation to be completed with measured inputs.
Support summarization
A SaaS team can route routine tickets to a lower-cost model and reserve a frontier tier for escalations. The benchmark should compare summary acceptance, escalation accuracy, output length, latency, and retry frequency. The value calculation is:
Monthly saving = incumbent monthly cost − routed monthly cost
The team should also record analyst review time. If the cheaper route creates more corrections, subtract that time from the apparent API saving rather than declaring victory from the invoice alone.
Contract review with reusable context
A legal technology team can cache stable instructions, clause taxonomies, and repeated policy text. Anthropic's published caching mechanics show why this can matter: cached reads cost 10% of standard input price, and a cited Sonnet 4.6 example moves from $3.00 to $0.30 per million input tokens for cached content, a $2.70 per million token difference on repeated material, as documented in this prompt caching guide.
The team should calculate cache writes, cache hits, uncached context, review corrections, and total contract cost. The resulting value is both money saved and reduced prompt processing, but only if the documents and instructions repeat enough to create reliable hits.
Product description generation
An e-commerce platform can test a hosted open-weight model against its current flagship for product descriptions. The comparison must include equivalent quality scoring, moderation, retry behavior, hosting fees, and engineering operations. A lower token price doesn't prove a lower total cost if self-hosting introduces GPU and maintenance obligations.
The most useful output is a before-and-after workload ledger. It should show model spend, supporting operations, accepted outputs, human review time, and migration effort. That ledger tells leaders whether the change saved money, saved time, improved throughput, or merely moved cost from the API invoice into infrastructure.
Implementing Cost Tracking and Optimization
Production visibility starts with one event per model call. Capture the provider, model identifier, input and output tokens, cache reads and writes when available, latency, retry count, validation outcome, workflow name, endpoint, and prompt version. Keep the metadata privacy-aware, especially when prompts may contain customer or confidential information.
A practical rollout
First 30 days, establish attribution. Add instrumentation through provider middleware, OpenTelemetry spans, or tools such as Helicone and LangSmith. Build dashboards by project, model, endpoint, and workload. Alert on unexpected spend changes and prompt-size increases, then reconcile the data with the provider invoice.
Days 31 to 60, run controlled trials. Route a measured portion of comparable traffic to a candidate model. Keep the incumbent as the baseline, evaluate quality on held-out examples, and compare cost per accepted task, not raw token spend. Track cache-hit rates and retrieval overhead separately so a model isn't rewarded or penalized for an architectural change that wasn't part of the test.
Days 61 to 90, automate the loop. Create weekly FinOps reviews, assign owners to the largest workload drivers, and establish rollback rules. A cheaper model should remain in trial if its quality regression is material, while a candidate that preserves the required quality and lowers accepted-task cost can move into broader routing.
SpendLens AI's AI observability platform is one option for this workflow. Its Python instrumentation can tag calls by workflow, task, feature, experiment, or endpoint, while its dashboard surfaces provider, model, token, cache, and per-call metrics. It also supports workload grouping and savings recommendations, which can help teams prioritize model-switch tests without changing their direct OpenAI or Anthropic request path.
A useful dashboard emphasizes cost per workload, cache efficiency, accepted-task rate, retry share, and quality trend. Raw monthly spend still matters, but it tells you what happened, not which engineering decision caused it. The operational goal is a repeatable loop: observe, benchmark, route, validate, and review.
SpendLens AI helps engineering and FinOps teams attribute OpenAI and Anthropic spend to workflows, inspect cache efficiency and prompt waste, and compare lower-cost model alternatives with estimated savings and migration risk. Visit SpendLens AI to instrument your existing calls and turn an ai model cost comparison into an ongoing cost-per-outcome practice.