AI Infrastructure Monitoring That Actually Saves Money
Practical AI infrastructure monitoring guide with real metrics, dashboards, and cost controls that cut LLM bills without sacrificing reliability.
Teams don't realize their AI costs are broken until the invoice shows up and finance asks what changed. The awkward part is that nothing obvious looks broken. Latency is acceptable, error rate is low, GPUs look healthy, and customers aren't complaining. Meanwhile one prompt edit, one model default change, or one routing rule can turn a predictable workload into the most expensive feature in the product.
That's why AI infrastructure monitoring has changed. It still needs telemetry, traces, and saturation graphs. But in practice, the teams that keep bills under control treat it as a FinOps system first. They watch which workflow spent the money, which prompt shape expanded token output, and which model handled traffic that didn't need premium reasoning in the first place.
The category itself reflects that shift. One 2026 estimate puts the AI observability market at USD 4.1 billion, growing to about USD 27.2 billion by 2035 at a 23.4% CAGR, with North America holding 40.2% of the 2026 market, or roughly USD 1.65 billion according to Globe Market Research's AI observability market estimate. Methodologies differ, but the pattern doesn't. Observability for AI has become its own enterprise budget line because LLM systems need continuous visibility into spend, usage, and quality.
Table of Contents
- Why Your AI Bill Doubled Overnight
- Core Metrics Every AI Stack Must Instrument
- What OpenAI, Anthropic, and Gemini Actually Expose
- Instrumenting Calls Without Rewriting Your Clients
- Dashboards and Alerts Engineers Actually Trust
- Anomaly Detection and Forecasting Before the Invoice
- Turning Monitoring Data Into Monthly Savings
Why Your AI Bill Doubled Overnight
A familiar Tuesday starts with a finance message and a screenshot of a much larger invoice than expected. Engineering checks uptime first. Nothing looks alarming. Requests are flowing, the app is responsive, and there isn't an incident to point at.
The problem is usually hiding one layer above infrastructure. A developer changes a summarization endpoint to a more expensive model. A product team adds more context to a prompt template. A retry path starts invoking the model twice. The system is still “healthy” by classic APM standards, but the bill has already moved.
Traditional dashboards miss the expensive path
Standard application monitoring answers useful questions. Are requests succeeding. Are dependencies slow. Is a service saturated. Those views still matter, but they don't explain unit economics.
A fast, successful LLM call can still be the most expensive line item of the month. That's the core monitoring mistake teams make. They instrument reliability and assume cost will reveal itself later.
Practical rule: If you can't attribute spend to a workflow, feature, or customer, you're not doing AI infrastructure monitoring yet. You're just collecting telemetry.
That gap is bigger than many teams expect. Recent commentary on AI observability argues that current stacks often capture compute, latency, and logs while missing the routing, retry, token-budget, and context-window decisions that generate inference cost. The useful framing is in this analysis of the unsolved AI observability gap.
FinOps is the operating model
The adjacent enterprise buying pattern already points this way. The AIOps market was estimated at USD 18.95 billion in 2026 and projected to reach USD 37.79 billion by 2031 at a 14.8% CAGR, with large enterprises representing 74.89% of purchasing power in 2025 and North America at 42.54% of revenue that year, according to Mordor Intelligence's AIOps market report. Monitoring gets funded when operations become too complex to manage by feel.
For AI workloads, complexity shows up in costs before it shows up in outages.
If you're trying to optimize monitoring spend in 2026, the same discipline applies to LLM operations. Instrument only the signals that help you make decisions, then tie them to ownership. Teams that also run cost anomaly detection for AI workloads usually catch invoice surprises earlier because they're watching behavior changes, not only infrastructure health.
What actually saves money
The teams that stay ahead of AI bills build a weekly habit around three questions:
- What changed: Model default, prompt version, retry logic, or routing rules.
- Who owns it: Endpoint, feature team, environment, or customer segment.
- What can be rolled back: Template, model choice, context size, or traffic policy.
That's the practical version of AI infrastructure monitoring that matters. Not prettier dashboards. Faster feedback on spend decisions.
Core Metrics Every AI Stack Must Instrument
You need two layers of signals. The first layer keeps the service alive. The second layer explains why the invoice moved.
Start with service health
The RED and USE patterns still work well for AI systems. Track Rate, Errors, Duration for request paths. Track Utilization, Saturation, Errors for infrastructure paths. The operational guidance that holds up in production is to alert on p95 and p99 latency, separate 4xx and 5xx errors, and treat saturation around 90% as the point where scaling or human response should kick in, based on this SRE monitoring guide covering RED and USE practices.
For AI workloads, that means looking at queue depth, concurrency, GPU saturation, and the tail of latency rather than averages.
CPU averages rarely explain user pain. Saturation and percentile latency usually do.
Add the LLM-native metrics that drive cost
Ray Serve's LLM observability guidance is close to what production teams need. A solid stack exposes request metrics plus engine metrics such as TTFT, TPOT, GPU cache utilization, batch size, throughput, latency, and error rates, with export to Prometheus and dashboarding in Grafana, as documented in Ray Serve LLM observability.
The cost side needs one more layer: token and attribution data.
A practical maturity path is to start with request counts and model names, then capture input and output tokens plus total cost, and finally attribute cost to users, sessions, and workflows tied to outcomes, as described in this token usage tracking maturity model. If you want a more applied view of slicing this data for operations, AI spend analytics workflows are useful for turning raw request logs into owner-level reporting.
AI Infrastructure Metrics Cheat Sheet
| Metric | Layer | Unit | Question it answers |
|---|---|---|---|
| Request rate | Service | requests | Is demand rising, falling, or spiking by endpoint |
| Error rate | Service | percent or count | Are users seeing failed calls, and is one model failing more often |
| Duration | Service | latency | Is the request path getting slower |
| GPU utilization | Infrastructure | utilization | Are accelerators actively busy or underused |
| Saturation | Infrastructure | saturation | Are queues, concurrency, or capacity limits causing pressure |
| Queue depth | Infrastructure | queued requests | Are requests waiting before execution |
| TTFT | LLM | time | Are users waiting too long before streaming starts |
| TPOT | LLM | time per token | Is token generation slowing under load |
| Throughput | LLM | tokens or requests over time | Is the engine producing enough work for current traffic |
| Prompt token count | Cost | tokens | Did a prompt edit increase input size |
| Completion token count | Cost | tokens | Are responses becoming longer than intended |
| Cost per request | Cost | currency | Which endpoint is expensive even when it succeeds |
| Cost per 1k tokens | Cost | currency | Which model or provider is expensive for this workload |
| Cache hit rate or cache token use | Cost and performance | ratio or tokens | Are repeated prompts benefiting from cache behavior |
Prioritize what to instrument first
Don't try to log everything on day one. The first dashboard that usually earns trust includes:
- Cost per request: This identifies expensive successful traffic immediately.
- Error rate: Failed retries and fallback loops often become hidden spend.
- TTFT: It catches regressions early, especially in streaming experiences.
After that, add prompt and completion token counts, TPOT, queue depth, and cache-related metrics.
What OpenAI, Anthropic, and Gemini Actually Expose
Provider assumptions waste a lot of time. Teams often design a dashboard around fields they expect to exist, then discover the API only exposes part of the story. The fastest way to avoid bad instrumentation is to normalize provider responses around what you can consistently capture now.
Where the providers differ
OpenAI, Anthropic, and Gemini all surface usage information, but the shape and depth aren't the same. That matters when you want per-request attribution, cache visibility, or latency analysis.
Anthropic is generally easier to work with if you care about cache-related detail at the request level. OpenAI is simpler for many teams because token accounting is familiar, but it often needs extra tracing work when you want richer latency context outside the response path. Gemini can expose useful usage metadata, but reasoning-heavy behavior can hide cost unless you explicitly log the right fields.
Provider Telemetry Comparison
| Signal | OpenAI | Anthropic | Gemini |
|---|---|---|---|
| Input token usage | prompt_tokens |
input_tokens |
prompt_token_count in usage_metadata |
| Output token usage | completion_tokens |
output_tokens |
candidates_token_count |
| Total token usage | total_tokens |
Derived from input and output fields | Available through usage metadata patterns rather than a single identical field |
| Cache-related usage | cached_tokens on supported models |
cache_read_input_tokens and separate cache creation token accounting |
cached_content_token_count, with coarser cache visibility |
| Per-request cache savings visibility | Partial | Strongest of the three | Limited |
| Latency detail in standard response handling | Present in response workflows, but often needs extra export for broader observability | Better trace-oriented visibility, including streaming-oriented metrics | Available, but less uniform for cache and reasoning analysis |
| Reasoning token visibility | Not framed the same way | Not framed the same way | thoughts_token_count for reasoning models |
The practical gap to plan for
Here's the mistake to avoid. Don't build separate dashboards for each provider's naming scheme. Build a unified event schema with fields like:
- provider
- model
- input_tokens
- output_tokens
- cached_tokens
- latency
- workflow
- prompt_template_version
- estimated_cost
That makes provider switching and cross-model review much easier. It also lets you compare workloads cleanly when product teams test alternatives. For teams evaluating Gemini-heavy paths, Gemini API pricing trade-offs are easier to reason about when token telemetry is already normalized across providers.
The provider with the nicest API response isn't always the easiest one to operate. The easiest one to operate is the one you can attribute consistently.
Instrumenting Calls Without Rewriting Your Clients
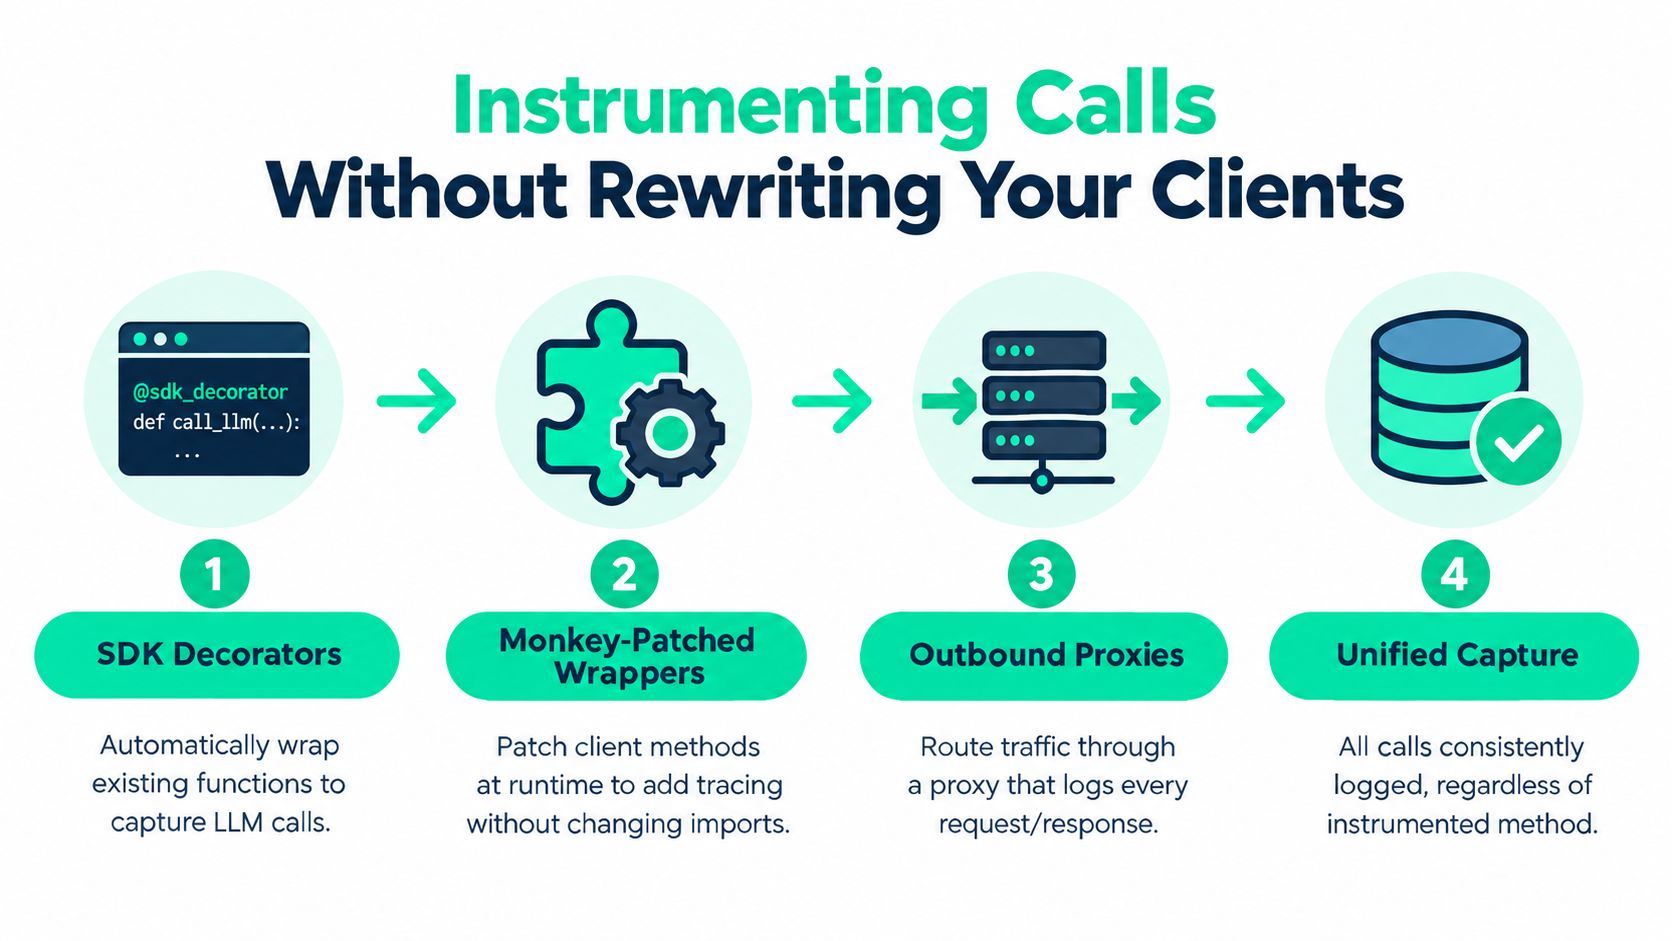
Most teams don't need a large refactor to get useful AI infrastructure monitoring in place. They need a capture layer that sits close to existing SDK usage, adds business tags, and emits a consistent event shape.
Use wrappers where your code already calls the model
The lowest-friction option is a decorator or helper wrapper around the functions that already make LLM requests. Add metadata there, not inside every product flow.
from functools import wraps
import time

def observe_llm(feature=None, workflow=None, environment="prod"):
    def decorator(fn):
        @wraps(fn)
        def wrapper(*args, **kwargs):
            start = time.time()
            response = fn(*args, **kwargs)
            duration_ms = int((time.time() - start) * 1000)

            event = {
                "feature": feature,
                "workflow": workflow,
                "environment": environment,
                "model": getattr(response, "model", None),
                "input_tokens": getattr(getattr(response, "usage", None), "prompt_tokens", None),
                "output_tokens": getattr(getattr(response, "usage", None), "completion_tokens", None),
                "duration_ms": duration_ms,
            }
            emit_observability_event(event)
            return response
        return wrapper
    return decorator
This works well when you control the call sites. It's enough for most Python services.
Patch clients when you can't touch every endpoint
If model access is spread across a larger Node.js codebase, wrap the client once and keep downstream code unchanged.
function wrapOpenAIClient(client, tags = {}) {
  const originalCreate = client.chat.completions.create.bind(client.chat.completions);

  client.chat.completions.create = async function(request, options) {
    const started = Date.now();
    const response = await originalCreate(request, options);

    const event = {
      provider: "openai",
      model: response.model,
      feature: tags.feature,
      workflow: tags.workflow,
      customer_id: tags.customer_id,
      prompt_template_version: tags.prompt_template_version,
      environment: tags.environment,
      input_tokens: response.usage?.prompt_tokens,
      output_tokens: response.usage?.completion_tokens,
      total_tokens: response.usage?.total_tokens,
      latency_ms: Date.now() - started
    };

    emitObservabilityEvent(event);
    return response;
  };

  return client;
}
This pattern is boring in the best way. Teams keep their existing retries, config, and imports.
Use tags that finance can read
The difference between telemetry and useful cost monitoring is tag quality. The minimum set I push teams to capture is:
- Feature: Search answer, support summarization, outbound email draft
- Workflow: RAG answer, classification, rewrite, extraction
- Customer or segment: Enterprise tenant, free tier, internal ops
- Prompt template version: So prompt edits show up in spend analysis
- Environment and release: To correlate spikes with deployments
Multiple observability guides converge on this same advice. Log token counts, model metadata, latency, retries, routing decisions, and cost estimates for each request, then tag them by customer, release, environment, team, or experiment, as outlined in this guide to AI cost visibility before the invoice.
For teams already using OpenTelemetry, keep enrichment close to span creation. OpenTelemetry instrumentation patterns for AI spend monitoring are a practical fit when you want async-safe context propagation across services.
from opentelemetry import trace

span = trace.get_current_span()
span.set_attribute("ai.feature", "support_summary")
span.set_attribute("ai.workflow", "ticket_digest")
span.set_attribute("ai.customer_id", customer_id)
span.set_attribute("ai.prompt_template_version", template_version)
span.set_attribute("ai.environment", "prod")
Outbound proxies still have a place when a legacy service can't be modified, but I avoid putting a proxy in the hot path unless there's no other choice. Wrappers and span enrichment are easier to maintain.
Dashboards and Alerts Engineers Actually Trust
The dashboards that survive are the ones that answer two questions in under a minute. Are users being hurt. Are we burning money faster than expected.
Everything else tends to get ignored after the first week.
Build percentile views, not comforting averages
For request paths, tail behavior matters more than averages. The same rule from general SRE applies here. Watch percentiles. In LLM systems, TTFT p95 and TPOT p95 or p99 usually tell you more than aggregate latency because they show whether the first streamed token or generation speed has started slipping under queue pressure or cache stress.
I like a top row with four panels:
- TTFT p50, p95, p99 by model
- TPOT p50, p95 by endpoint
- Error rate by model and feature
- Cost per request by workflow
Put cost beside latency, not on a separate executive tab. If engineers can't see the cost consequence of a latency or retry regression in the same view, they won't connect the incident to the bill.
Use alerting that matches symptoms
Absolute token thresholds are noisy. A large customer, a launch day, or a batch job can trip them without any real problem. Burn-rate style alerts are better because they fire on sustained badness.
The best alert isn't the fastest one. It's the one a service owner won't mute.
Attribution is what makes this operationally useful. One practical pattern is to track input and output tokens per request, map them to dollars using provider pricing, and sort traces by token cost so expensive flows are obvious, as described in this guide to LLM observability in production deployments.
High-Signal vs. Noisy AI Infrastructure Alerts
| Alert | Signal | Why It Works or Fails |
|---|---|---|
| TTFT p95 regression by endpoint | High signal | Catches streaming regressions before aggregate latency looks bad |
| Cost burn rate by workflow | High signal | Detects sustained overspend instead of one-off peaks |
| Cache hit drop after release | High signal | Surfaces prompt or routing changes that increase cost quietly |
| Error rate by model | High signal | Helps isolate provider or model-specific instability |
| Prompt template version drift with spend increase | High signal | Connects deployment changes directly to rising token use |
| Raw total token count threshold | Noisy | Traffic growth and healthy batch jobs trigger it too easily |
| Average latency only | Noisy | Hides tail regressions that users feel first |
| CPU average alert | Noisy | Often misses queueing and saturation on the actual bottleneck |
| Daily spend alert without attribution | Noisy | Tells you something is wrong, but not who owns it |
Route alerts to owners, not everyone
Slack is fine for informational burn-rate notices. PagerDuty should be reserved for incidents that affect users or burn through budget in a way that needs immediate action. Routing rules should follow ownership tags such as feature, team, and environment.
If your support AI is expensive, page the support AI owner. Don't dump it into a shared platform channel and hope someone cares.
Anomaly Detection and Forecasting Before the Invoice
Good AI infrastructure monitoring doesn't wait for the monthly bill. It spots the shape of a problem while there's still time to roll something back.
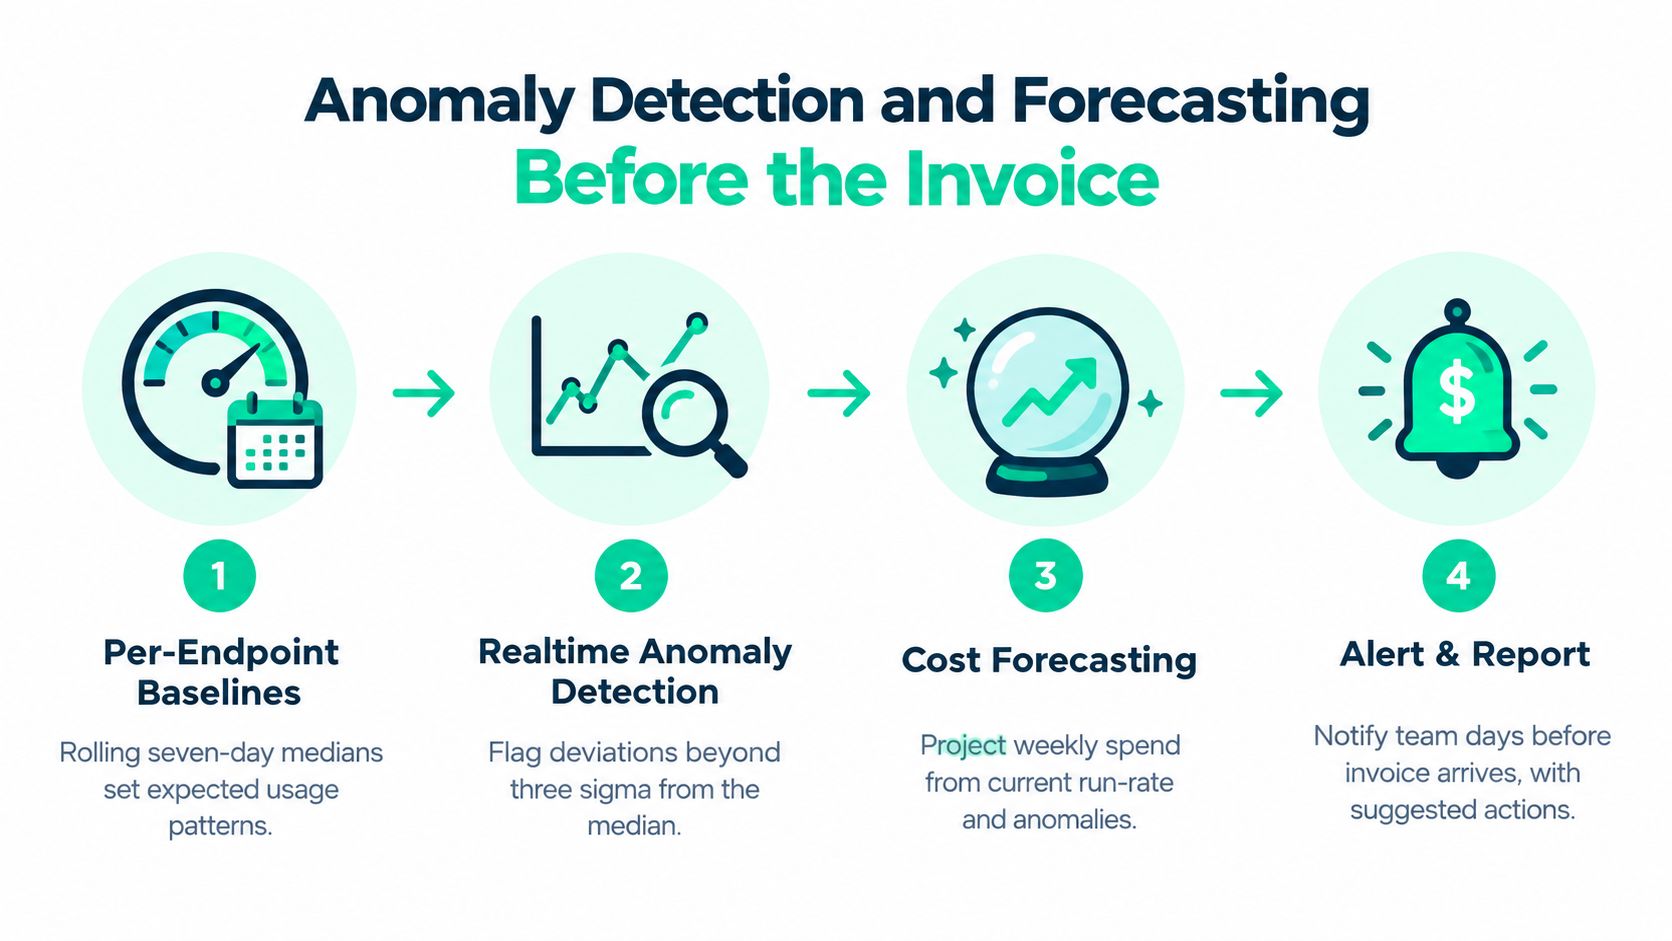
A simple four-step loop
The practical loop is straightforward.
- Baseline each endpoint using recent behavior for token volume, cost per request, and cache-related signals.
- Separate pattern from noise so weekend usage doesn't trigger weekday panic.
- Detect change points after prompt edits, model swaps, or routing changes.
- Attach rollback options so an alert leads to action, not just a graph.
A lot of teams overcomplicate this. You don't need a research project. You need enough context to answer whether a cost change came from traffic, prompt shape, retry behavior, or model selection.
For teams looking at broader operational patterns, the SigOS anomaly detection guide is a useful reference for thinking about real-time baselines and outlier handling.
Work the incident like an engineer, not an analyst
A good anomaly workflow looks like this in practice:
- Spend spike appears on one endpoint, not globally.
- Template version changed in the same release window.
- Output tokens rose while traffic stayed normal.
- Rollback happens before the invoice cycle turns it into a budget surprise.
That's where platforms focused on AI cost operations become useful. For example, SpendLens AI adds lightweight instrumentation to existing code and surfaces spend drivers, cache efficiency, and model-switch opportunities across OpenAI and Anthropic workloads. The useful part isn't that it's another dashboard. It's that the routing and cost signals stay close to the engineering workflow instead of getting buried in a separate BI tool.
This short walkthrough is worth watching if you want to see anomaly-style operational thinking in a visual format.
Forecasting that people will actually use
Forecasts become useful when they're simple enough to trust. I've seen teams get more value from “current run rate looks materially above normal for this endpoint” than from a mathematically elegant prediction nobody believes.
A workable weekly forecast review usually checks:
- Endpoints trending above baseline
- New prompt versions with larger token footprints
- Provider or model mix shifts
- Cache effectiveness changes
- Whether rollback or rerouting would lower next week's spend
That saves time because the investigation starts with likely causes instead of broad hunting. It also saves money because corrective action happens before finance closes the month.
Turning Monitoring Data Into Monthly Savings
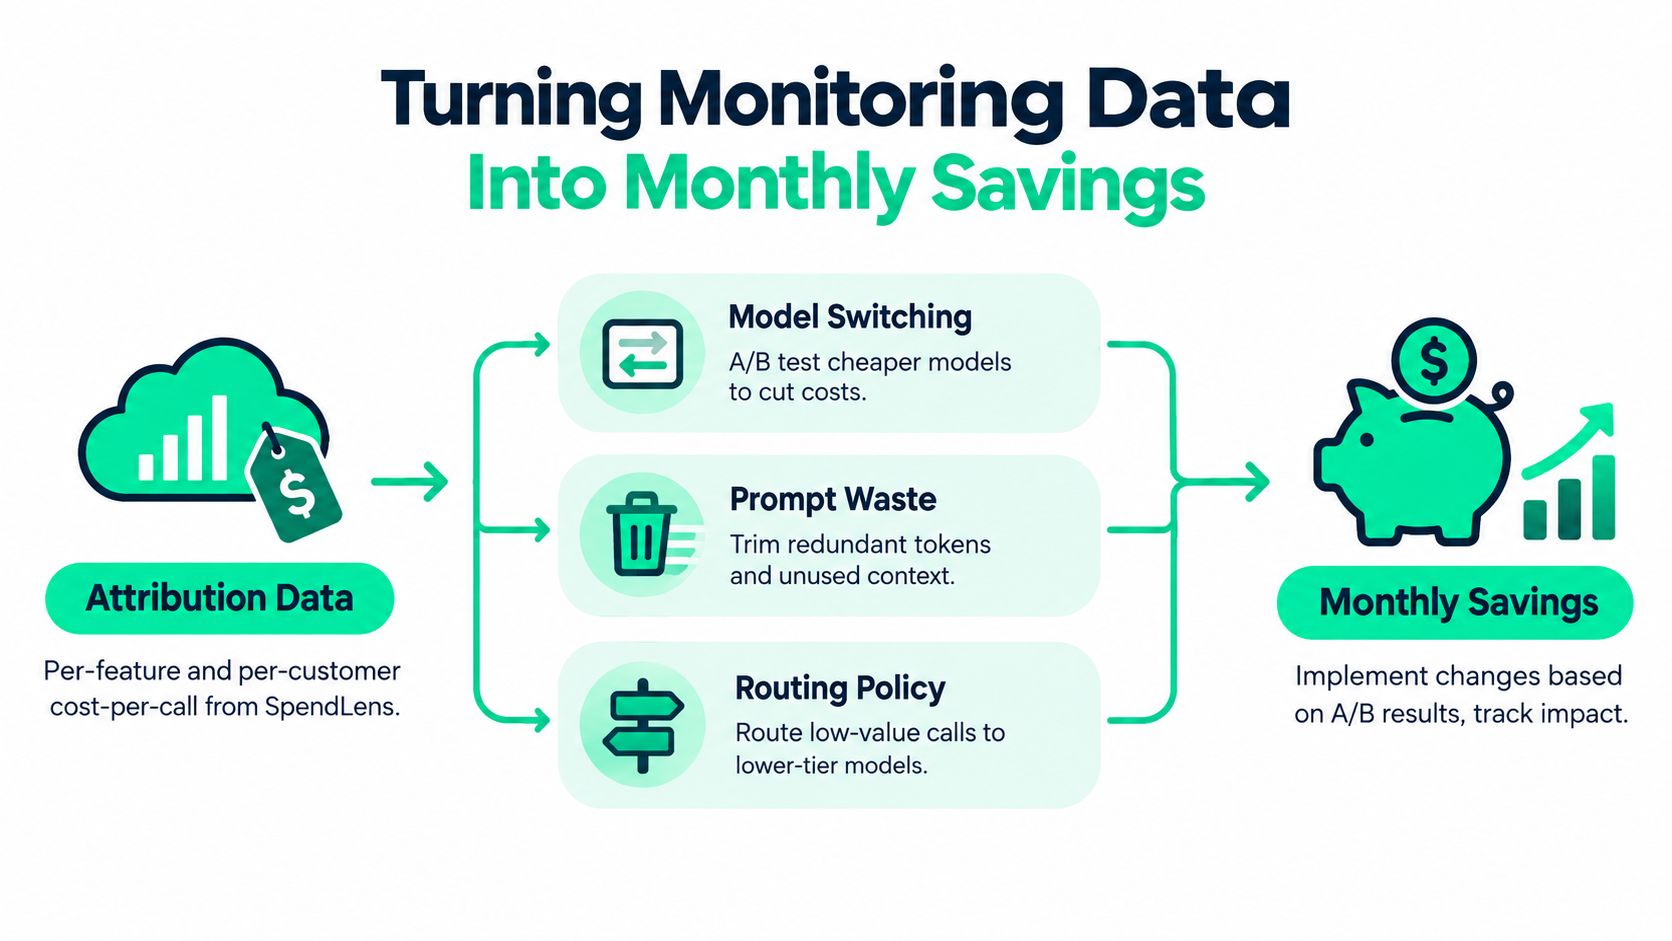
Monitoring only matters if it changes decisions. The fastest path from telemetry to savings is to tie attribution data to three recurring levers: model switching, prompt waste, and routing policy.
Model switching is the cleanest savings lever
Once you have per-feature cost per call, some candidates stand out immediately. Summaries, classifications, rewrites, and extraction steps often don't need your most expensive model. The right move isn't blind downgrading. It's small A/B tests on narrow workloads with clear quality checks.
Money saved here tends to be durable because you're changing the default path, not asking engineers to remember to behave better.
Prompt waste is the easiest waste to miss
Prompt bloat creeps in through good intentions. A team adds more examples, more formatting rules, more context history, or repeated instructions. Nothing breaks. Output quality may even improve slightly. But token counts drift up and stay there.
The fix is mechanical:
- Trim repeated instructions: Move stable rules into system-level templates where possible.
- Cut unused context: Don't attach documents or conversation history the model won't use.
- Constrain output shape: Shorter answers often solve the actual product requirement.
- Review after edits: Any template release should be checked for token growth.
This saves time too. Smaller prompts are easier to debug, easier to compare across releases, and easier for product teams to reason about.
Routing policy is where compounding gains show up
Routing rules often start simple and get messy over time. A fallback added during an outage stays in place. A premium model becomes the default for all traffic because no one revisits the rule. A low-stakes path inherits the same model as a high-stakes path.
A short weekly review is enough to keep this under control.
A 15-minute weekly savings review
- Look at top spend drivers by workflow
- Check model mix changes since the last release
- Review prompt versions with rising token counts
- Pick one routing or model test for the next week
- Log expected savings and owner
I keep a simple savings ledger with these fields:
| Field | What to record |
|---|---|
| Opportunity | Model switch, prompt trim, routing change |
| Owner | Team or engineer responsible |
| Affected workflow | Endpoint or feature |
| Gross savings | Expected reduction if fully adopted |
| Realized savings | Actual reduction after release |
| Risk notes | Quality or latency trade-offs |
| Status | Planned, testing, shipped, rolled back |
Build a monthly cadence, not a one-time cleanup
The best outcome of AI infrastructure monitoring is a ranked list of next month's cuts. Not generic “optimize prompts” advice. Specific actions tied to owner, workflow, and expected impact.
That habit saves money and time. Engineers spend less time arguing about where costs came from because attribution already exists. Finance spends less time chasing teams for explanations. Product leaders get clearer trade-offs between quality and spend.
If you do this consistently, savings compound. You don't need a dramatic rewrite to materially reduce the annual bill. You need steady visibility, a weekly review, and the discipline to turn observations into changes.
If you want that operating loop without rebuilding your observability stack, SpendLens AI gives engineering teams lightweight instrumentation for OpenAI and Anthropic workloads, plus attribution, cache efficiency, and model-switch visibility tied to real workflows. It fits this exact job: catching expensive changes early, showing who owns them, and turning AI infrastructure monitoring into a repeatable monthly savings practice.