
AI in Budgeting and Forecasting: A Practical Guide for 2026
Learn how AI in budgeting and forecasting cuts cycle time, lifts accuracy, and reshapes finance teams. Practical use cases, risks, and a 2026 implementation
A Thursday close can turn AI in budgeting and forecasting from an interesting idea into an urgent operational decision. The FP&A lead has a board deck open, thirty spreadsheets feeding the number, and three versions that disagree. Sales has just revised its pipeline, the CFO wants an answer by morning, and nobody can explain which assumptions changed or why the forecast moved.
That situation is common because finance teams often automate the visible layer first. A polished dashboard can generate a forecast, but production deployment depends on less visible work: reliable ERP and CRM data, versioned logic, accountable owners, monitoring, and a clear budget for the AI workload itself. AI has entered production use in finance planning, but adoption remains uneven. A 2025 survey found that only 12% of organizations had AI budgeting and forecasting fully in production, while 41% of FP&A teams used AI for at least one planning function (finance AI adoption and automation data).
Table of Contents
- The Moment Every Finance Team Reaches for AI
- Core Concepts Behind AI Budgeting and Forecasting
- Model Families and When Each One Wins
- Where AI Moves the Needle
- Data Requirements and the Hidden Plumbing
- Accuracy Gains, Risk Surfaces, and the New AI Cost Line
- Build Versus Buy and the Vendor Landscape
- A Practical 90-Day Rollout for Product and Finance Teams
The Moment Every Finance Team Reaches for AI
Forecast meetings usually start with reconciliation, not decisions. An FP&A manager exports actuals from the ERP, downloads pipeline from the CRM, requests revised assumptions from department leaders, and rebuilds a workbook that already exists in several conflicting versions. One file has the latest headcount plan, another reflects the approved hiring freeze, and a third still uses last quarter's revenue assumptions.
Speed is only one pressure. Assumptions remain in people's heads, macros function as unowned applications, and the audit trail stops at the last emailed file. A ten-day planning cycle turns a late sales update into a choice between presenting a stale number and approving an untested revision.

What changes when the loop becomes continuous
An AI forecasting layer can ingest ERP actuals, CRM pipeline, product telemetry, and operating drivers on a recurring schedule. It can return a range rather than a supposedly precise figure, identify the variables behind a movement, and draft explanations for major variances. Finance retains decision authority while analysts spend less time assembling evidence.
Production quality depends on the surrounding controls. Engineering teams need governed data pipelines, versioned prompts or model logic, permission boundaries, monitoring, and a cost owner for inference and data processing. A forecast that runs quickly but cannot show its inputs, assumptions, or operating cost is still a fragile finance process.
The cycle-time potential is material. A 2025 finance survey reports that AI budgeting tools can reduce annual budget cycle time by 30% to 40% and compress rolling forecast cycles from four to six weeks down to one to two weeks (survey findings on AI budgeting automation). Shorter cycles give leaders more chances to reprice, adjust hiring timing, or redirect spending while the facts remain current.
Practical rule: Treat AI as a decision system only when a named finance owner can inspect the inputs, challenge the output, approve the action, and review its cost. Define those responsibilities in team accountability in operational workflows.
Core Concepts Behind AI Budgeting and Forecasting
Finance teams do not need to become machine-learning researchers, but they do need a shared vocabulary and clear operating boundaries. Four building blocks recur in credible implementations, each with a different role in the production workflow.
Machine-learning forecasting
Machine-learning forecasting uses historical outcomes and current drivers to estimate future revenue, expenses, cash flow, or other financial metrics. Gradient boosting models learn how variables interact, while recurrent networks and other sequence models learn patterns across time. A weather model offers a useful comparison: it learns from past pressure, temperature, and wind conditions, yet still depends on current observations and can fail when conditions differ from its training history.
A review of corporate budget forecasting reported hybrid Random Forest and big-data models reaching 93.2% predictive accuracy, while noting that LSTM models can perform strongly on time-series data but are less interpretable (review of machine-learning budget forecasting). That trade-off matters when a forecast affects hiring, capex, or a board commitment. Production teams also need to record the training data, feature definitions, refresh schedule, and model version behind each result.
LLMs in FP&A
Large language models excel at reading and writing. They can summarize contracts, extract renewal clauses from vendor invoices, classify variance commentary, and answer questions over approved planning documents. An LLM functions as a fast analyst draft-writer rather than a calculator. It can prepare useful commentary, but a finance professional must verify calculations, source references, and accounting context.
The control boundary should be explicit. Retrieval must be limited to approved documents, outputs should retain source references, and prompt or model changes need review. Engineering also needs to track inference volume and data-processing cost, because a convenient narrative layer can become an uncapped operating expense.
Rolling forecasts
A rolling forecast replaces a frozen annual or quarterly view with a projection that updates as actuals arrive. The cleanest mental model is a living probability distribution rather than a fixed promise. The team refreshes the horizon, reviews changed drivers, and records why the range moved.
AI budgeting
AI budgeting applies these forecasts to constrained decisions, including allocation, capex pacing, cost controls, and hiring plans. The model might recommend delaying a requisition when demand indicators weaken, while the budget owner evaluates customer commitments, delivery risk, and strategic priorities.
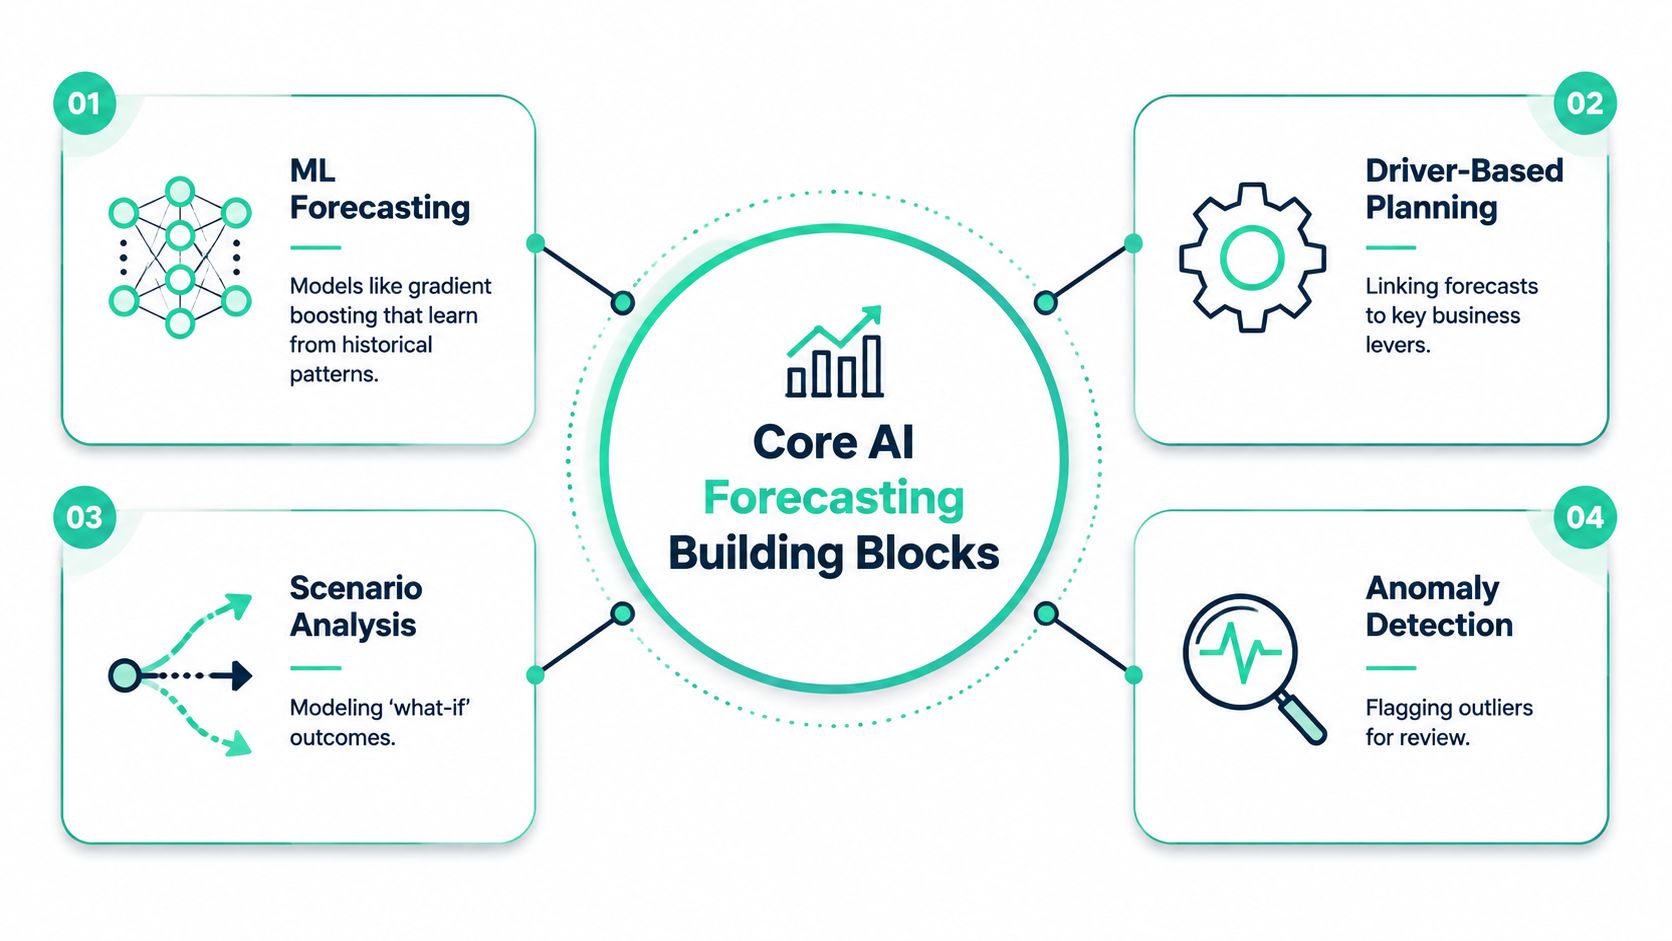
Separating prediction from explanation prevents weak deployments. Statistical models calculate the numbers, controlled data retrieval supplies evidence, and language models turn approved evidence into readable commentary. Each layer needs an owner, an audit trail, and a defined failure path.
Model Families and When Each One Wins
Model choice should follow the data's shape, the decision being supported, and the level of accountability finance requires. A forecast that performs well in a demo can still fail in production if its inputs are late, its drivers are undocumented, or no owner is assigned to review exceptions. Finance leaders typically need clear answers on forecast quality, explainability, and the data and engineering work required to operate the model.
| Model Family | Accuracy on Stable Series | Interpretability | Data & Engineering Footprint | Best Fit Use Case |
|---|---|---|---|---|
| Classical ML and time series | Strong when history is limited and drivers are well defined | Generally high, especially with feature importance and decompositions | Lower to moderate | Revenue, expense, and driver-based forecasts with shorter histories |
| Deep learning | Strongest when many time-dependent drivers interact | Lower, particularly for complex sequence behavior | High | Multivariate planning with long, dense histories |
| LLMs and retrieval-augmented generation | Not appropriate as the primary numeric forecaster | Readable output, but factual reliability depends on retrieval and controls | Moderate, with significant evaluation needs | Variance narration, contract extraction, and scenario questions |
| Hybrid stacks | Strong practical balance when numeric and qualitative work are separated | Numeric layer can remain auditable, narrative layer can be constrained | Moderate to high | Production FP&A systems combining forecasts, explanations, and exception triage |
Classical methods such as XGBoost, Prophet, and SARIMA often fit short histories, stable series, and driver-based planning. Their outputs are easier to inspect through feature importance, decompositions, and residual checks. They can break when stationarity assumptions or recurring seasonal patterns no longer describe the business, so teams need monitoring rather than a one-time validation exercise.
Deep-learning families such as Temporal Fusion Transformers, N-BEATS, and LSTM become useful when long, multivariate histories contain interactions across demand, pricing, capacity, and other time-dependent drivers. They require more data pipelines, retraining controls, and compute budget. Concept drift remains the main operational risk. A model trained during a stable commercial period may perform poorly after a major pricing change, rate shock, acquisition, or demand regime shift.
LLMs should sit beside the forecast, not in its arithmetic path. They can turn approved structured outputs into commentary such as “pipeline conversion weakened in the enterprise segment.” They may also invent a line item or cite evidence that does not exist unless retrieval, schema validation, and human review constrain the workflow. Keep model-generated narrative separate from the calculation layer, with logging and an explicit approval owner.
A 2025 comparative study of Transformer, XGBoost, and hybrid models in volatile markets reported Transformer accuracy of 0.91 in stable markets and 0.84 in high-volatility regimes, compared with 0.83 and 0.74 for XGBoost, while hybrid and sentiment-augmented models remained above 0.82 accuracy under high volatility (a 2025 comparative study of Transformer, XGBoost, and hybrid models in volatile markets). The practical implication is a separated production stack: ML calculates the forecast, while a controlled language layer handles narrative and exception workflows. That separation also makes AI infrastructure cost easier to measure by pipeline, model, and review workload.
Where AI Moves the Needle
AI creates the most value where finance repeatedly applies structured judgment and must explain the result. It contributes less when business drivers are stable, historical variance is narrow, or the available data contains too little signal. The production question is therefore operational: can the team connect each model output to an approved driver, a review owner, and a measurable decision?
Revenue forecasting
Revenue forecasting is often the first credible target. Finance can connect bookings, pipeline stages, renewal dates, pricing, customer segments, and product usage to recognized revenue. A model can compare the current pipeline shape with historical conversion behavior, then show which assumptions create the forecast range.
That changes the working rhythm for finance and sales. Analysts can test whether a shift in enterprise win rates matters more than a change in average contract value, and whether a quarterly shortfall reflects timing or a structural change. The useful output is an explainable range with traceable drivers, not a polished point estimate that no one owns.
Rolling forecasts
A rolling process updates assumptions as actuals arrive instead of waiting for the next formal planning event. The 2025 survey cited earlier reports forecast accuracy improvements of 30% to 50% versus spreadsheet-based methods, with top teams reaching 90% to 95% accuracy compared with 65% to 75% for manual approaches (finance planning automation findings).
An academic summary of a 2023 industry study reported that AI-enhanced forecasting reduced prediction errors by 31.7% and cut planning cycle duration by up to 68% compared with conventional methods. It also reported that AI-supported rolling forecasts reduced forecast errors by 35.8% on average and lowered manual effort by 68.7% (peer-reviewed summary of AI-driven planning approaches). Those gains matter only when actuals, overrides, and model versions remain auditable. Time recovered from spreadsheet maintenance can support scenario design, risk review, and executive decisions.
Scenario modeling
Natural-language prompts can make driver trees easier for finance partners to use. A request such as “What happens if European churn rises?” should become a documented change to the relevant driver, a rerun of the approved model, and a result showing affected assumptions. The workflow should preserve the scenario, input values, user, and approval status for later review.
The language interface should be constrained by the model schema. If an LLM invents a driver, changes a unit, or applies an assumption to the wrong entity, its fluent response can still be financially useless. Engineering must validate units, entity scope, permissions, and output format before the result reaches a planning workbook or executive report.
Anomaly detection
Anomaly detection can flag duplicate vendor entries, unusual accruals, sudden expense spikes, or a mismatch between operational activity and posted spend. Isolation Forests and similar methods can prioritize review. An LLM can then draft a plain-language explanation from approved ledger evidence, while the reviewer confirms the disposition.
The business case is stronger where the review population is large, missed exceptions have meaningful consequences, and a human can close the loop. It is weaker in a cost center with narrow, predictable expense patterns. A colorful vendor demonstration does not establish value.
A separate budgeting study reported that companies using AI achieved up to an 88% increase in forecasting accuracy, alongside a budgeting performance score of 4.5 out of 5 for AI users (study of AI use in budgeting performance). Treat those results as evidence of potential, not a deployment promise. Measure the outcome against the company's baseline, forecast horizon, override rate, review time, and infrastructure spend. That last measure belongs in the operating case: every additional model call, retrieval step, and human review adds to the AI cost base.
Data Requirements and the Hidden Plumbing
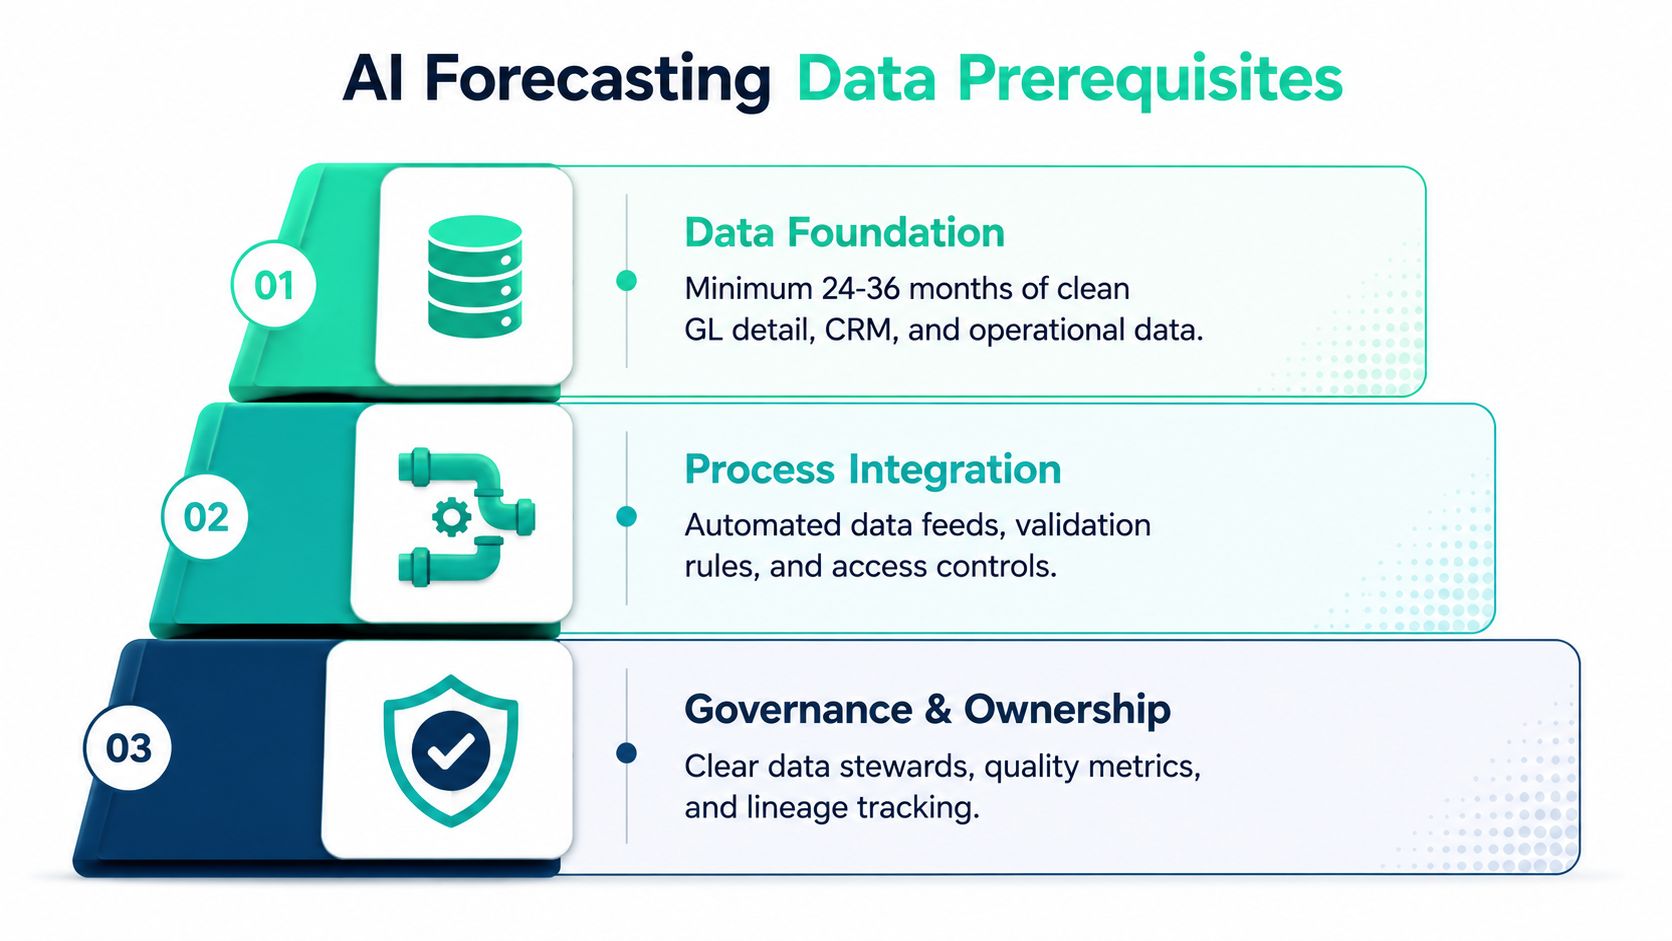
A forecasting demo can produce a polished chart from a clean sample file. Production work starts earlier: finance and engineering must agree on entities, periods, measures, permissions, and ownership. If “Acme Corporation” has different names in the CRM, ERP, and billing systems, the model cannot reliably connect those records.
The data foundation
Start with general-ledger detail, revenue and headcount history, and a joined CRM-to-ERP pipeline table. Where available, 24 to 36 months of historical data gives the model more operating context, especially when it includes sub-account detail rather than summarized totals. Label actuals, budgets, forecasts, adjustments, and late postings separately.
Reconciliation comes before training. Confirm that booked revenue maps to the same customer, product, entity, and period used in the ledger. Resolve unit conversions, duplicate records, late-arriving data, and ownership changes. A model trained on unresolved mappings will reproduce those errors at scale.
Integration is a product requirement
Nightly ELT into a warehouse is generally easier to audit than manual exports. Dimension tables should cover cost centers, products, entities, customers, and organizational ownership. A feature store, or an equivalent transformation layer, can recompute win rates, average selling price, seasonality lags, hiring velocity, and other drivers on a defined schedule.
Validation must stop bad inputs visibly. A missing entity mapping should trigger an alert and block the pipeline, rather than become a null feature that reaches a forecast. Engineering should also budget for storage, transformation jobs, feature computation, and model calls. Those choices determine the recurring AI cost base long after the prototype is approved.
Governance keeps trust intact
Version datasets, transformations, model artifacts, prompts, retrieval indexes, and approvals. Trace each forecast output back to source tables, record the model version and approving owner, and document intended use, exclusions, known weaknesses, and evaluation results in model cards. Set a retraining cadence that changes only through a recorded decision.
The familiar failure pattern is an impressive notebook followed by six months of unexplained misses. A November forecast that missed by 12% may reflect a schema change, a broken mapping, or a genuine business shift, but without logs the team cannot distinguish them. Data quality and fragmentation remain major organizational barriers. For production monitoring practices, finance and platform teams can review this guide to endpoint monitoring.
Accuracy Gains, Risk Surfaces, and the New AI Cost Line
AI forecasting reduces repetitive production work, but the return depends on the starting process. A published BCG analysis found that AI can shorten planning cycles and improve forecast accuracy, yet those outcomes matter only when a company measures its own rolling error, cycle time, and human review burden. A strong demo does not prove production value. The model must survive real data changes, exception handling, and budget ownership.
Automation also widens the risk surface. A model can overfit a recent window, miss a regime change, or under-forecast an emerging segment because its training data underrepresents that segment. An LLM may generate confident commentary about a line item that does not exist. A minor upstream schema change can alter features without producing an obvious failure.
Controls for model risk
Finance should review more than one accuracy score. Track error by entity, segment, horizon, and forecast direction. Compare predicted ranges with actual outcomes, record human overrides, and require explanations for material changes. During unusual periods, a constrained model with visible drivers may be safer than a complex model that performs well under ordinary conditions.
Governance test: If an analyst cannot identify the source data, changed driver, model version, and approving owner behind a forecast, the output is not ready to drive a budget decision.
Production accountability depends on more than model selection. Assign an owner for each forecast, define escalation rules for missed thresholds, and separate approval from model maintenance where practical. Logs should preserve the input snapshot, feature values, output, override, and final decision. Without that chain, a missed forecast becomes an argument instead of an investigation.
The cost model needs the same discipline. Inference calls, token volume, embedding refreshes, retrieval operations, evaluation runs, and retraining jobs all consume resources. Finance and engineering should assign ownership, establish rate cards, set usage assumptions, and monitor cost per forecast or planning scenario.
A plain planning formula keeps the exposure visible:
Monthly AI cost = inference calls × average tokens × cost per token + retraining overhead
A workflow that expands context on every request can become expensive even when its per-call price looks small. Instrument calls by feature, model, provider, and environment. Reforecast when traffic, prompt design, retrieval scope, or model routing changes. Teams setting up this operating discipline can review guidance on the cost of AI.
Production deployment therefore requires two linked controls. Finance needs forecast quality and decision accountability. Engineering needs reliable data paths, observable model behavior, and a measured AI cost base. Neither layer can compensate for the other.
Build Versus Buy and the Vendor Landscape
The choice is rarely a clean build-or-buy decision. Four practical paths cover most finance teams, and each still requires implementation work. A vertical FP&A suite such as Anaplan, Pigment, or Vena supplies planning workflows and controls. Forecasting-native products such as Causal or Jedox can shorten the route to a usable model. A data-platform approach built on Databricks or Snowflake offers deeper integration for organizations with a mature warehouse. An in-house stack can combine open-source forecasting libraries, internal data services, and controlled LLM workflows.
| Path | Time to First Forecast | Total Cost of Ownership | Model Transparency | Integration Depth | Best Fit |
|---|---|---|---|---|---|
| Vertical FP&A suite | Faster when processes fit the product | Subscription plus implementation and configuration | Varies by model and workflow | Strong inside supported planning processes | Finance-led teams needing governed collaboration |
| Forecasting-native vendor | Often quick for a focused target | Product cost plus integration work | Usually clearer for the core forecast | Moderate | Teams with a defined forecasting problem |
| Data platform with embedded ML | Slower initial setup | Platform, engineering, and operating costs | High when the team owns the pipeline | Deep | Companies with strong data engineering capacity |
| In-house stack | Slowest unless reusable infrastructure exists | Ongoing data, ML, monitoring, and AI spend ownership | Potentially highest | Deepest | Organizations with dedicated data and ML teams |
A polished demo does not prove production readiness. Vendor demonstrations often assume clean mappings, stable permissions, and cooperative users. Before signing, test historical backfills, entity changes, late-arriving data, approval exceptions, and export requirements. Proprietary data models can make migration painful, while an internal build pays off only if the team can maintain lineage, monitoring, retraining, and visibility into AI spend.
Ownership also changes the economics. A subscription may reduce initial engineering work but leave integration, configuration, and usage costs to the buyer. A data-platform deployment gives engineers more control over pipelines and model routing, but the company owns uptime, evaluation, incident response, and provider-cost changes. An in-house stack offers the most control and the largest permanent operating obligation.
Use a suite when collaboration and governance lead the decision. Choose a focused vendor when the forecast is narrow and speed matters. Use the data platform when integration complexity is the differentiator. Build internally only when forecast complexity justifies lasting engineering ownership. If LLM workflows are involved, compare provider economics with an LLM pricing comparison across OpenAI, Anthropic, and other providers. For attribution across providers and workloads, SpendLens AI provides instrumentation and dashboards for LLM usage, spend drivers, cache efficiency, and model-switch opportunities.
A Practical 90-Day Rollout for Product and Finance Teams
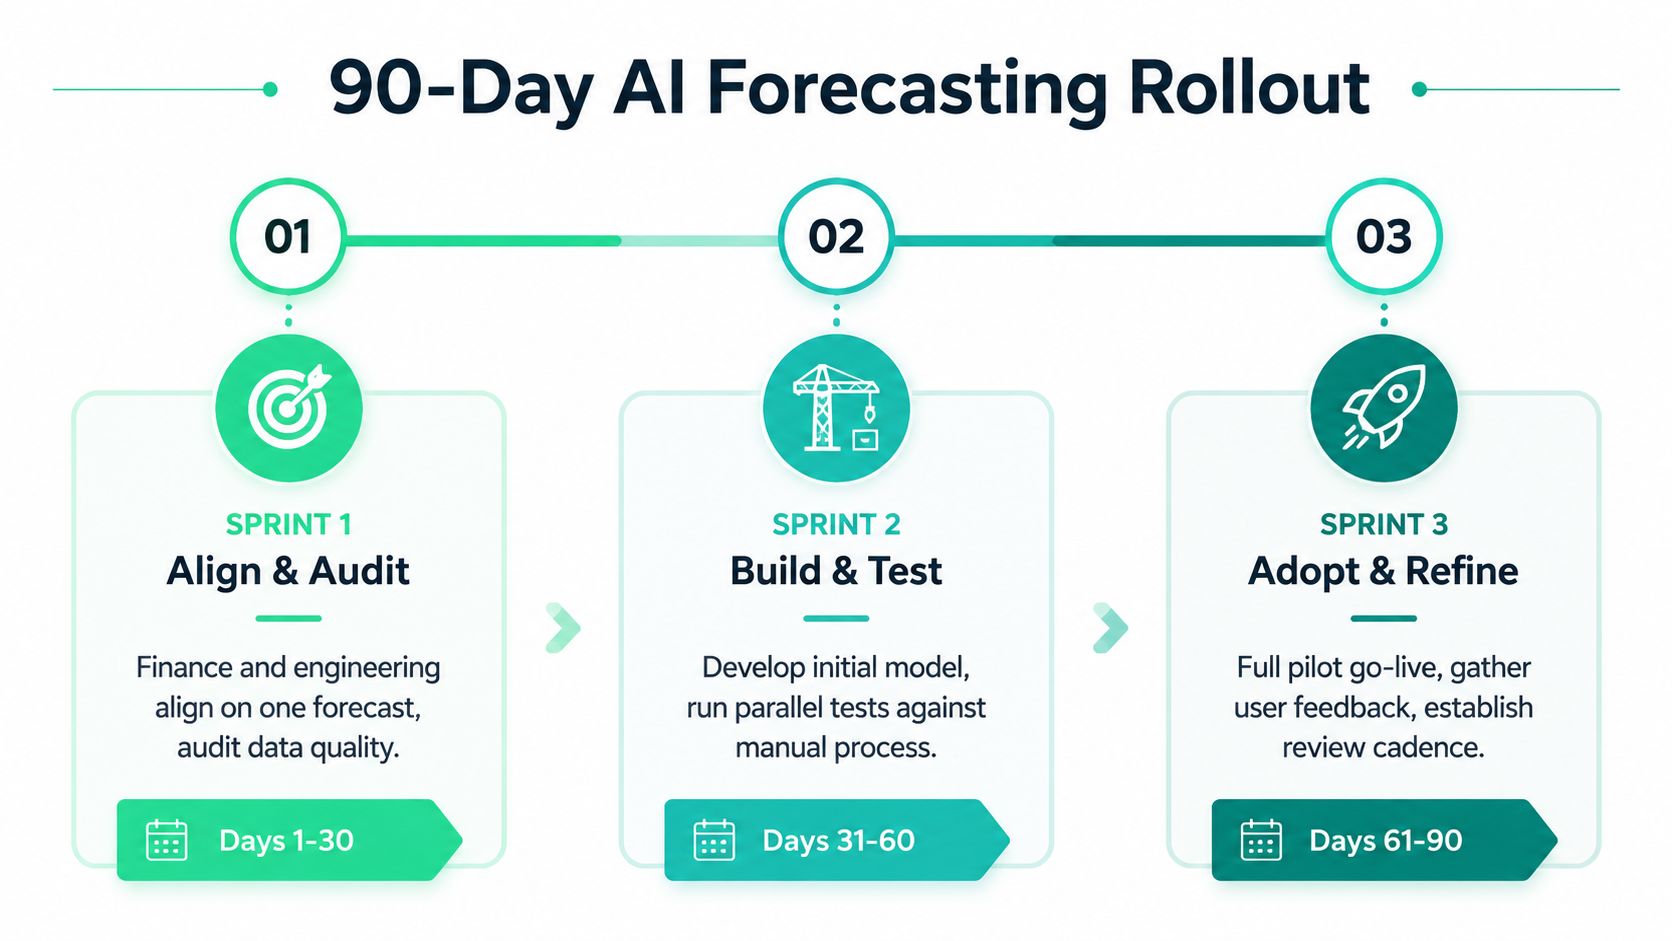
Set one forecast target and assign its owner before implementation begins. Finance and engineering should agree on the baseline, the decision the output will support, the source systems involved, and how AI usage costs will be attributed.
Days 1 to 30
Select a high-value series, audit the source data, document business definitions, and instrument the AI workload. Record missing fields, late-arriving data, entity changes, and manual adjustments. These details determine whether a demo can become a production process.
Days 31 to 60
Ship a narrow baseline and run it alongside the legacy process. Measure rolling error, drift, segment bias, human overrides, forecast production time, and inference cost. Keep both outputs in review until analysts can explain material disagreements and confirm which exceptions require human judgment.
A model that is accurate but expensive to run can still fail the business case.
Days 61 to 90
Add controlled scenario narratives and anomaly explanations. Document approval paths, model versions, retrieval sources, and audit trails. Then review the results with budget owners, engineering, and the people accountable for acting on the forecast.
Leadership should track four signals: cycle time reduced by half, documented MAPE improvement across rolling windows, a finance-user override rate that declines month over month, and AI inference cost per forecast recorded against a budget. If accuracy, adoption, or cost control fails to improve, a larger model will not fix the operational gap.
SpendLens AI helps product and engineering teams attribute LLM usage by workload, provider, model, and feature. Visit SpendLens AI to instrument AI spend, identify costly prompt and model patterns, and include the forecasting workload in the finance plan.