AI Cost Reduction: A Practical Guide to Lower LLM Spend
Learn practical AI cost reduction strategies for LLM workloads, with real savings examples, prompt caching wins, and tips to track spend without slowing teams.
GPT-3.5-class inference costs fell from about $20 per million tokens in November 2022 to roughly $0.07 by October 2024, a decline of more than 280× in about two years, according to the LLM Token Price Index. Yet many product teams still watch their AI bills rise. The reason is simple: cheaper tokens don't help if invisible usage keeps multiplying.
AI cost reduction starts with visibility. You need to know which workflow made a request, which model handled it, how much context it processed, whether the call was repeated, and whether the resulting output created business value. Once that information exists, prompt caching, model routing, output controls, and usage cleanup can turn a confusing invoice into an engineering problem with measurable savings.
Table of Contents
- Why AI Bills Keep Climbing Even as Model Prices Fall
- What AI Cost Reduction Actually Means
- The Four Levers That Move the Number
- Cutting Token Waste Through Prompt and Cache Design
- Choosing a Cheaper Model Without Losing Quality
- Instrumentation, KPIs, and ROI Tracking
- A 90-Day Plan to Reduce LLM Spend
- When a Dedicated Platform Pays for Itself
Why AI Bills Keep Climbing Even as Model Prices Fall
Lower inference rates do not automatically reduce an AI bill. Product usage expands into background summarization, retrieval, reranking, embeddings, evaluations, retries, and agent tool calls. Each feature may seem inexpensive, yet the combined request volume can outweigh the rate reduction.
The AI economics snapshot cited above shows that model pricing has continued to fall. Planning around that trend helps, but it does not reveal which workflows are consuming budget. A repeated request, oversized context window, or unused production evaluation still multiplies costs across every user and job.
Invisible workloads are usually the first leak
The largest unexamined expense is often a workflow no product launch included. It might be a background reranking pipeline without a clear owner, an embeddings refresh triggered by every content update, or an evaluation job that remained active after testing.
Retries create another leak. A frontend timeout can send a second request while the first is still running. Without deduplication by request ID, the customer receives one answer while the company pays for two calls.
Prompt growth is quieter but persistent. A support prompt that started at 400 tokens can reach 4,000 after teams add policy text, examples, tool definitions, brand guidance, and edge-case instructions. Even with lower model rates, every request now carries ten times more static context.
Practical rule: Before switching providers, identify the workflows generating spend. Remove calls that do not need to exist, cache stable prefixes, and route routine work to a smaller model.
Start with a spend map grouped by feature, environment, model, and workflow. The guide to AI spend analytics provides a useful framework, though a tagged event table in an existing observability system can work just as well. Record request IDs, token counts, cache status, retry counts, and owners so engineers can connect an invoice line to an actual decision.
The order matters. Visibility comes before optimization. Once a team can see which calls repeat, which prompts grow, and which workflows produce value, it can choose between caching, model switching, batching, or deletion. Prices set the unit cost. Untracked usage determines how many units the business buys.
What AI Cost Reduction Actually Means
AI cost reduction means lowering total model and supporting-service spend while preserving the business outcome of the feature. The objective isn't to choose the cheapest model. A cheaper summary that forces agents to reread, correct, or escalate the result may increase the true cost of the workflow.
Four cost drivers deserve separate treatment:
- Input tokens include system prompts, conversation history, retrieved documents, tool schemas, and user content.
- Output tokens include the generated answer, structured fields, tool arguments, and reasoning-related output where billed.
- Request count multiplies orchestration overhead, retries, rate-limit pressure, and auxiliary operations.
- Supporting services include vector stores, rerankers, embeddings, speech-to-text, storage, and evaluation pipelines.
A practical comparison makes the point. Suppose two support summarization systems each process 10 million input tokens and 2 million output tokens per day. Pipeline A sends the full prompt to Claude Sonnet for every summary. Pipeline B places the stable system instructions first, reuses that prefix through caching, sends the summary task to Haiku, and removes an unnecessary embedding call. The plan specifies an 8× bill difference at the same quality score. That result comes from design and allocation, not from changing the amount of customer content processed.
| Dimension | Pipeline A, Unoptimized | Pipeline B, Optimized |
|---|---|---|
| Input volume | 10 million tokens per day | 10 million tokens per day |
| Output volume | 2 million tokens per day | 2 million tokens per day |
| Prompt handling | Full prompt recomputed on each request | Stable prefix reused through caching |
| Model choice | Claude Sonnet for the full workflow | Haiku for the summary task |
| Auxiliary work | Redundant embedding call remains | Unnecessary embedding call removed |
| Result | Higher bill | 8× lower bill at the same quality score |
The example also shows why token counts alone don't explain an invoice. Two workloads can process identical volumes while producing very different bills because one pays premium rates for every stage and repeats work that the other reuses or eliminates.
Teams planning an AI FinOps operating model should allocate spend to workflows before optimizing individual requests. Once costs are attached to features and outcomes, engineers can compare cost per resolved task, not merely cost per million tokens.
The Four Levers That Move the Number
The highest-impact work usually changes how the application reuses context and assigns tasks. The four levers below provide a practical order of operations, but the savings ranges in planning notes shouldn't be treated as universal guarantees. Actual results depend on prompt structure, provider pricing, cache eligibility, model quality, and workload mix.
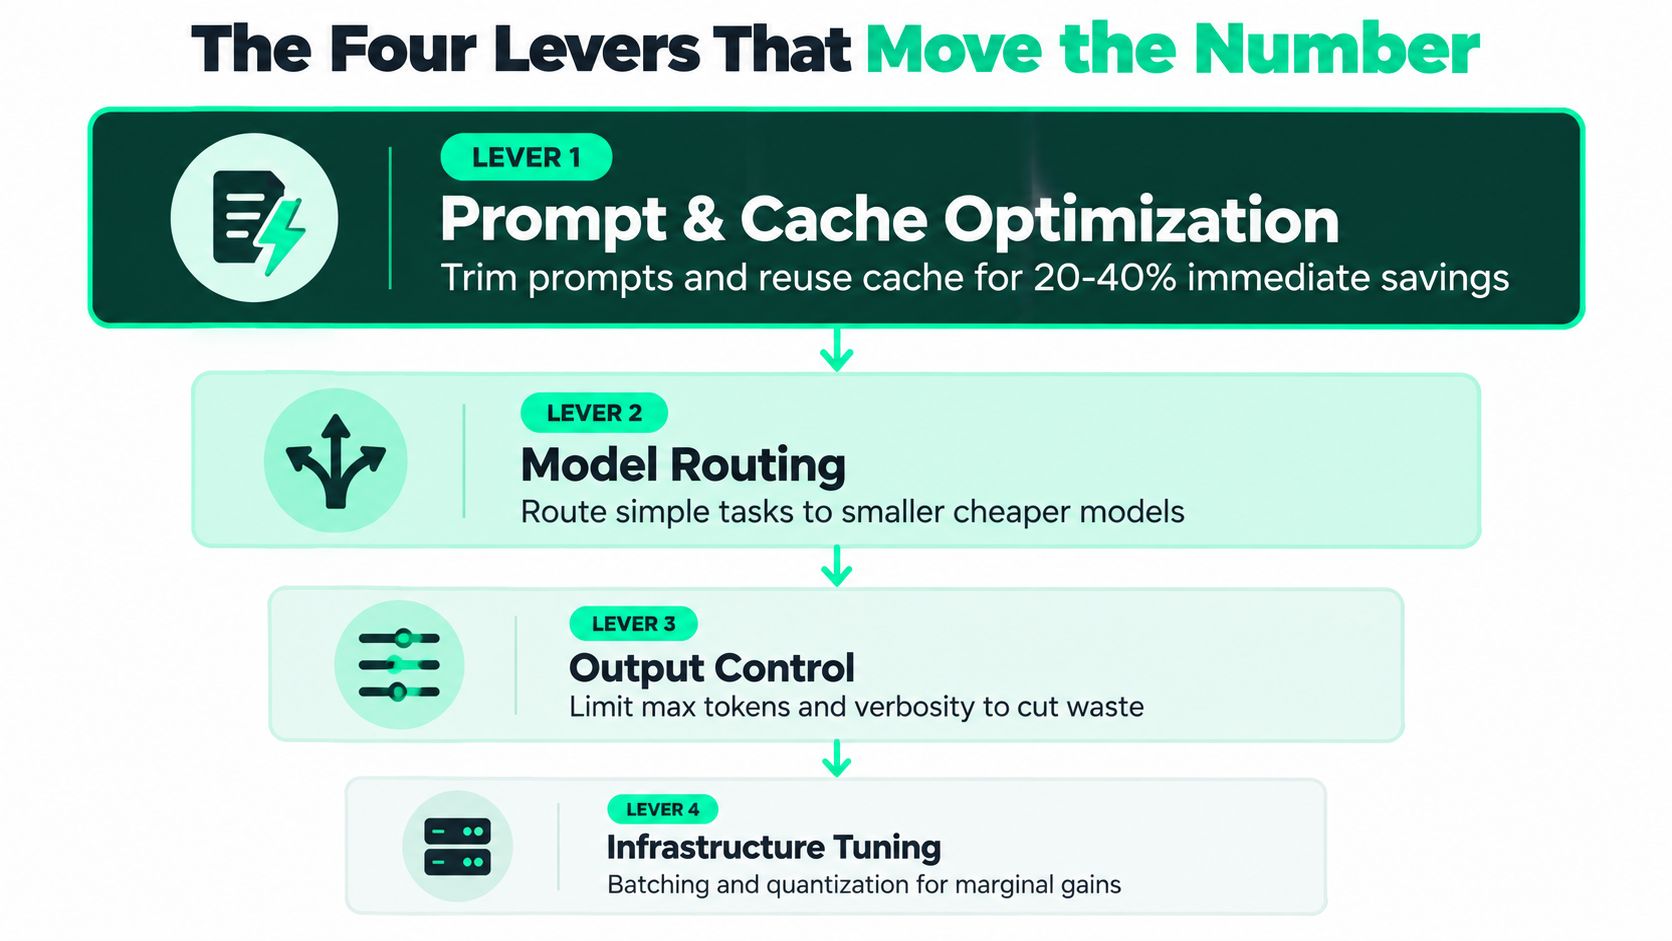
1. Prompt caching and prefix reuse
Prompt caching is often the strongest first optimization for retrieval-augmented and agent workloads. The ProjectDiscovery evaluation found API-cost reductions of 45% to 80% across providers, with time-to-first-token improvements of 13% to 31%. Its measured savings varied by model and cache mode, including 79% to 81% for GPT-5.2, 78% to 79% for Claude Sonnet 4.5, 46% to 48% for GPT-4o, and 28% to 41% for Gemini 2.5 Pro.
Caching works when stable instructions, tool schemas, or reference material appear in the same prefix across calls. The provider reuses computed prefill work instead of processing that content repeatedly. A prompt caching infrastructure guide describes cached-token pricing as roughly 10× lower on repeated prefixes, with total request savings of about 50% to 90% depending on the static-to-dynamic token ratio.
2. Model routing and right-sizing
A flagship model shouldn't handle every classification, extraction, moderation, or routing decision. Send simple, bounded tasks to smaller models and reserve expensive reasoning capacity for cases that need it. The quality risk is real, so routing must use an evaluation set and an agreed failure threshold.
3. Prompt and output control
Remove repeated instructions, constrain output schemas, set sensible completion limits, and stop tools from returning unnecessary context. These changes lower both input and output consumption, while also making responses easier to validate.
4. Instrumentation and usage hygiene
Delete duplicate calls, batch compatible work, disable unused shadow pipelines, and investigate retry storms. The direct saving may be smaller than a model migration, but measurement is foundational. Caching without observability is guesswork, and routing without quality and cost data can move spend from one workflow to another.
For teams budgeting a larger agentic build, AI development budget planning is useful context because architecture choices determine recurring inference and orchestration costs long after the initial launch.
Cutting Token Waste Through Prompt and Cache Design
Most prompt waste hides in static content. A support request may contain the same policy rules, tool definitions, formatting constraints, and brand instructions for every customer, while only the conversation and question change. Sending that entire prefix through full prefill on every call makes the variable request pay for context that never changed.
Start with an audit. Remove redundant instructions, merge overlapping rules, and replace long few-shot examples with concise examples that demonstrate only the required behavior. Then move stable material into a deterministic prefix before the variable user content.
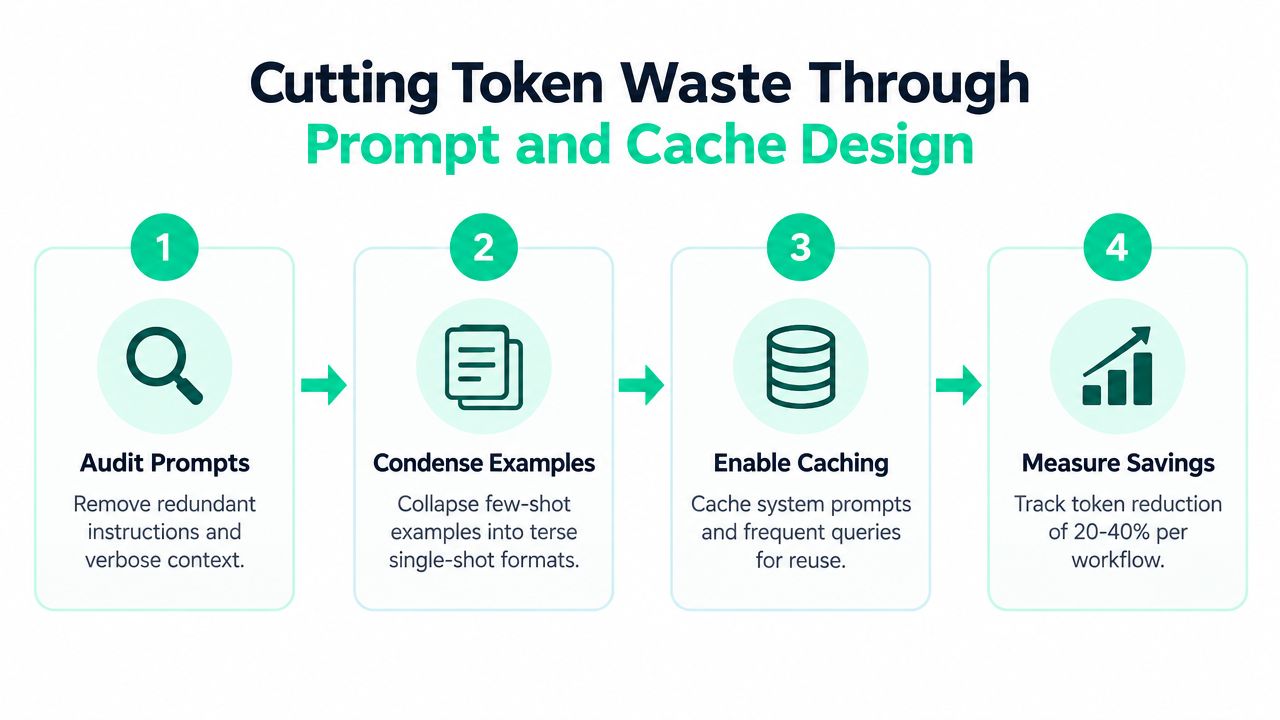
A production guide reports that auditing and trimming a system prompt can remove 40% to 60% of system-prompt tokens, while prefix caching can save 50% to 90% on the cached prefix and semantic response caching can eliminate 30% to 70% of repeat calls. The same guide describes combined reductions of 60% to 80% for a typical production workload, depending on how much repeated context exists. See the detailed cache hit ratio guidance before setting a target.
A simple before-and-after illustrates the mechanics. A 2,800-token support prompt can be reduced to 1,100 tokens by removing duplicated policy language and compressing examples. If the remaining stable prefix is cacheable, the effective request cost can fall from roughly $0.014 to $0.003 at GPT-4o-class pricing. Those dollar figures are workload-specific, so the engineering decision should rely on your provider's current billing and observed cache behavior.
Cache design checklist
- Stable ordering: Keep system instructions, tool schemas, and reusable reference material in a consistent order.
- Dynamic tail: Put user-specific messages, timestamps, request IDs, and changing retrieval results after the stable prefix.
- Provider behavior: Anthropic offers automatic prompt caching, while OpenAI implementations commonly use a manually designed cached-prefix pattern.
- Hit-rate testing: Measure cache hits by workflow, not only across the entire application.
- Failure analysis: Timestamp injection, per-user ordering, and provider-specific generation settings can fragment prefixes and lower reuse.
Cache hits also affect latency because the model skips repeated prefill work. A low hit rate means the prompt may look cache-friendly in code while behaving like a fully dynamic request in production.
Before placing a cache behind every endpoint, inspect the prompt structure. A system prompt with changing dates, user-specific rules, or reordered tools may not provide enough stable material to justify the complexity.
Choosing a Cheaper Model Without Losing Quality
Model switching is a comparison problem, not a price hunt. A lower-cost model is useful only when it preserves the outcome your product needs, including factual accuracy, format adherence, tool-calling reliability, and acceptable latency.
Build an evaluation set from representative production prompts. The plan should include 200 to 500 prompts, run with identical system instructions, and score each candidate against a fixed rubric. Record quality, p95 latency, cache fit, and effective cost per resolved task rather than comparing token rates alone.
| Model tier | Quality vs flagship | Latency p95 | Price per 1M tokens, in/out | Cache fit |
|---|---|---|---|---|
| Flagship model | Baseline | Measure in your workload | Provider pricing | Strong when prefixes are stable |
| Smaller general model | Evaluate against baseline | Measure in your workload | Lower than flagship in many deployments | Usually suitable for stable prefixes |
| Reasoning-focused model | May improve difficult tasks | Measure in your workload | Often higher for complex work | Depends on provider and prompt structure |
| Specialized or open model | Task-dependent | Measure in your workload | Compare total serving cost | Test prefix and batching behavior |
A realistic routing experiment might move summarization from GPT-4o to GPT-4o-mini, producing about 85% token savings with a 2-point quality drop. The same migration can fail for reasoning-heavy extraction if accuracy falls 11 points. Those figures belong to the specified evaluation example, not a general promise about every workload.
Use a migration experiment ID and compare results by task. If the smaller model handles short summaries but struggles with ambiguous policy decisions, route by complexity instead of changing the entire feature. A model routing implementation guide can help organize that split.
The decision rule is straightforward: switch when quality stays within an agreed band, tool calls remain reliable, latency meets the product requirement, and per-task cost drops materially. If the cheaper model creates manual review or customer-support work, include that downstream expense in the comparison.
Instrumentation, KPIs, and ROI Tracking
You can't reduce what you can't see. Every LLM request should carry structured metadata that lets engineering and finance answer the same question: which workflow created this spend, and what did the request accomplish?
Use a consistent taxonomy across services:
- Feature: The customer-facing capability, such as support summaries or document extraction.
- Environment: Development, staging, evaluation, or production.
- Model: Provider, model family, and version.
- User tier: Internal, trial, standard, or enterprise.
- Workflow: The specific operation, such as retrieval, reranking, summarization, or tool execution.
Track the metrics that expose both cost and operational behavior. The core set includes cost per workflow, cost per active user, cache hit rate, prompt-cache savings, model mix, and forecast variance against plan.
A dashboard that supports decisions
A Grafana or Looker view should let a platform engineer filter spend by feature, model, provider, and environment. It should surface the top three workflows driving 60% of cost and alert the owner when weekly spend drifts more than 15% from forecast. Those thresholds are useful dashboard examples, but each team should set them against its own budget and traffic pattern.
Tag requests before and after an intervention. For example, assign a migration experiment ID to calls moved from a flagship model to a smaller candidate. The next review can then compare request volume, quality outcomes, cache behavior, and spend without relying on a before-and-after invoice that mixes unrelated deployments.

A minimum viable stack for one or two LLM features needs request-level metadata, provider usage fields, a durable cost table, a dashboard, and alerts for unusual volume. It doesn't need a new proxy or a full platform rewrite. Direct provider calls can remain in place while instrumentation records the context needed for attribution.
The business case for this discipline is clear in the 2025 State of AI Cost Management release, which reports that 85% of companies missed AI forecasts by more than 10%, with limited visibility identified as the top challenge. Forecast accuracy improves when teams can isolate the workflow driving variance instead of reacting to a total bill.
A 90-Day Plan to Reduce LLM Spend
A useful ai cost reduction program starts with evidence, captures reversible savings, and then changes architecture. The sequence below keeps teams from optimizing a prompt before they know whether that prompt is responsible for meaningful spend.
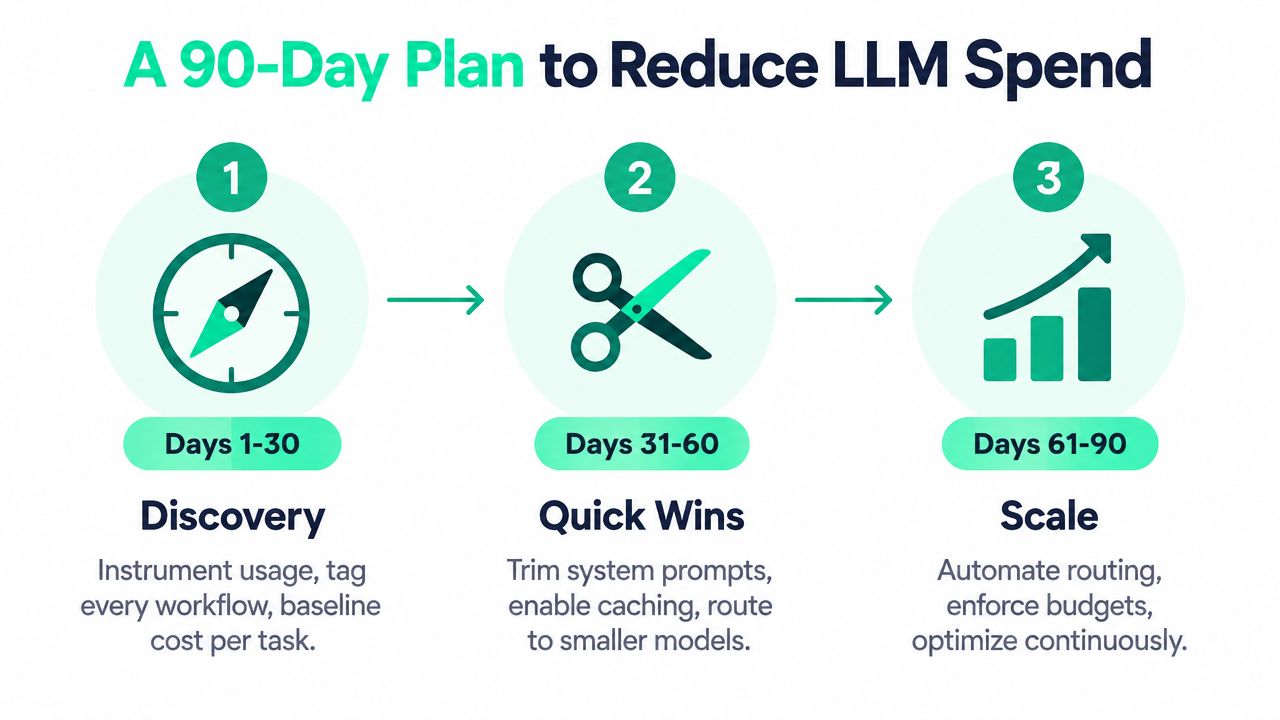
Days 1 to 30, discovery
Instrument every provider call and tag it by feature, environment, model, user tier, and workflow. Establish a baseline for cost per task, input and output tokens, request count, cache behavior, and forecast variance. The first month should produce an ownership map, not a rushed model migration.
Days 31 to 60, quick wins
Trim oversized system prompts, remove duplicate instructions, and move stable content into cache-friendly prefixes. The specified planning ranges associate prompt cleanup with 15% to 30% savings and prompt caching, where applicable, with 40% to 70% savings. These are workload-dependent ranges, so validate each change against quality and observed cache hits.
Switch lightweight calls to smaller models only after running representative evaluations. A routing improvement may contribute another 20% to 35% in the planning example, but the actual result depends on how much traffic can move safely and whether the smaller model handles the task without extra retries or reviews.
Days 61 to 90, scale
Prune retrieval context, batch compatible operations, classify workloads by complexity, and automate model routing. Add budget alerts and require an owner for every recurring background pipeline. Review the savings by experiment ID, then keep the changes that preserve quality and remove the ones that only move cost elsewhere.
Run this review quarterly. Prompt templates, tool schemas, traffic patterns, and model prices change as features ship. Without a recurring review, yesterday's optimization can become tomorrow's unused cache, oversized prompt, or expensive default route.
When a Dedicated Platform Pays for Itself
The threshold question is engineering effort. At monthly spend below roughly $2,000, a shared dashboard, disciplined tags, and a spreadsheet or existing observability tool are often enough. Teams can inspect the largest workflows manually and avoid adding another system before the data justifies it.
Above roughly $20,000 per month, manual investigation becomes harder to sustain. Building vendor-agnostic capture, forecasting, prompt-waste detection, cache analysis, anomaly alerts, and model comparison internally can consume platform-engineering time that would otherwise go toward product reliability.
| Monthly LLM spend | Recommended approach | Why |
|---|---|---|
| Below roughly $2,000 | Spreadsheet plus existing observability | Manual review is usually manageable when workflow count and provider complexity are limited |
| Between roughly $2,000 and $20,000 | Shared dashboard with structured tagging | Teams need repeatable attribution, alerts, and experiment tracking before costs become opaque |
| Above roughly $20,000 | Dedicated platform or mature internal tooling | Forecasting, routing analysis, cache measurement, and anomaly detection justify specialized engineering effort |
SpendLens AI is one option for teams that want lightweight instrumentation across OpenAI and Anthropic workloads without placing a proxy in the request path. Its workflow-level tracking can attribute calls by feature, task, experiment, or endpoint, while its dashboard surfaces token use, cache efficiency, prompt waste signals, and model-switch opportunities.
Mature platform teams may prefer internal tooling, especially when they already operate a unified FinOps data warehouse and have engineers available to maintain provider integrations. Smaller teams often need to decide whether the next engineer should build cost infrastructure or improve the product. For leadership teams shaping that decision, a fractional CAIO can provide an outside perspective on governance, architecture, and investment priorities.
The practical test is whether better attribution will uncover savings faster than the tooling costs in engineering time. If your invoice is small and your workflows are simple, start with tags and a spreadsheet. If multiple providers, teams, environments, and agentic workflows make ownership unclear, a dedicated system can pay for itself by showing where to act first.
SpendLens AI helps engineering teams attribute OpenAI and Anthropic usage by workflow, monitor cache efficiency, identify prompt waste, and compare lower-cost model options without replacing their existing provider clients. Visit SpendLens AI to see how its instrumentation and savings analysis can turn AI cost reduction from invoice investigation into a repeatable engineering process.